14 Oct 2026
 Kubernetes Blog
Why Is My Kubernetes Job Still Pending? Tracing Kueue Admission with Headlamp
You submit a Kubernetes Job and wait for its Pods to appear. A minute passes. Then another. The Job is still suspended, there are no application logs, and there may not even be a Pod to inspect.
In a cluster managed by Kueue, this can be completely normal. Kueue may still be deciding whether the Job can use the requested resources. The useful question is not only "Why is the Pod pending?" It is first "Has Kueue admitted the Workload?"
The Kueue plugin for Headlamp brings that investigation into the Headlamp UI. Instead of reconstructing the admission path from several commands and large YAML objects, you can begin with the Workload, read its condition message, and follow links through the LocalQueue, ClusterQueue, ResourceFlavor, and Cohort.
This article follows that Headlamp-first path. The command line appears only in a short optional section for reproducing the example.
Before you begin
You need a Kubernetes cluster with Kueue installed, a Headlamp installation, and the 0.1.0-alpha Kueue plugin. Your Kubernetes identity must be allowed to read the Kueue resources used in this article.
The alpha release provides read-only views for Kueue v1beta2 Cohorts, ClusterQueues, LocalQueues, ResourceFlavors, and Workloads. It does not add its own create, edit, stop, resume, or delete workflows. Headlamp still provides its standard YAML and resource actions where your permissions allow them.
First, separate admission from Pod scheduling
Kueue and the Kubernetes scheduler answer different questions.
-
Kueue admission: Should this Workload start now, considering queue policy, quota, ResourceFlavors, admission checks, and other waiting Workloads?
-
Pod scheduling: After the Workload is admitted and the Job resumes, which nodes can run its Pods?
That boundary changes the investigation. If the Workload is not admitted, stay in the Kueue section of Headlamp. If it is admitted but its Pods are still Pending, move to Headlamp's normal Job and Pod views and inspect scheduler events.
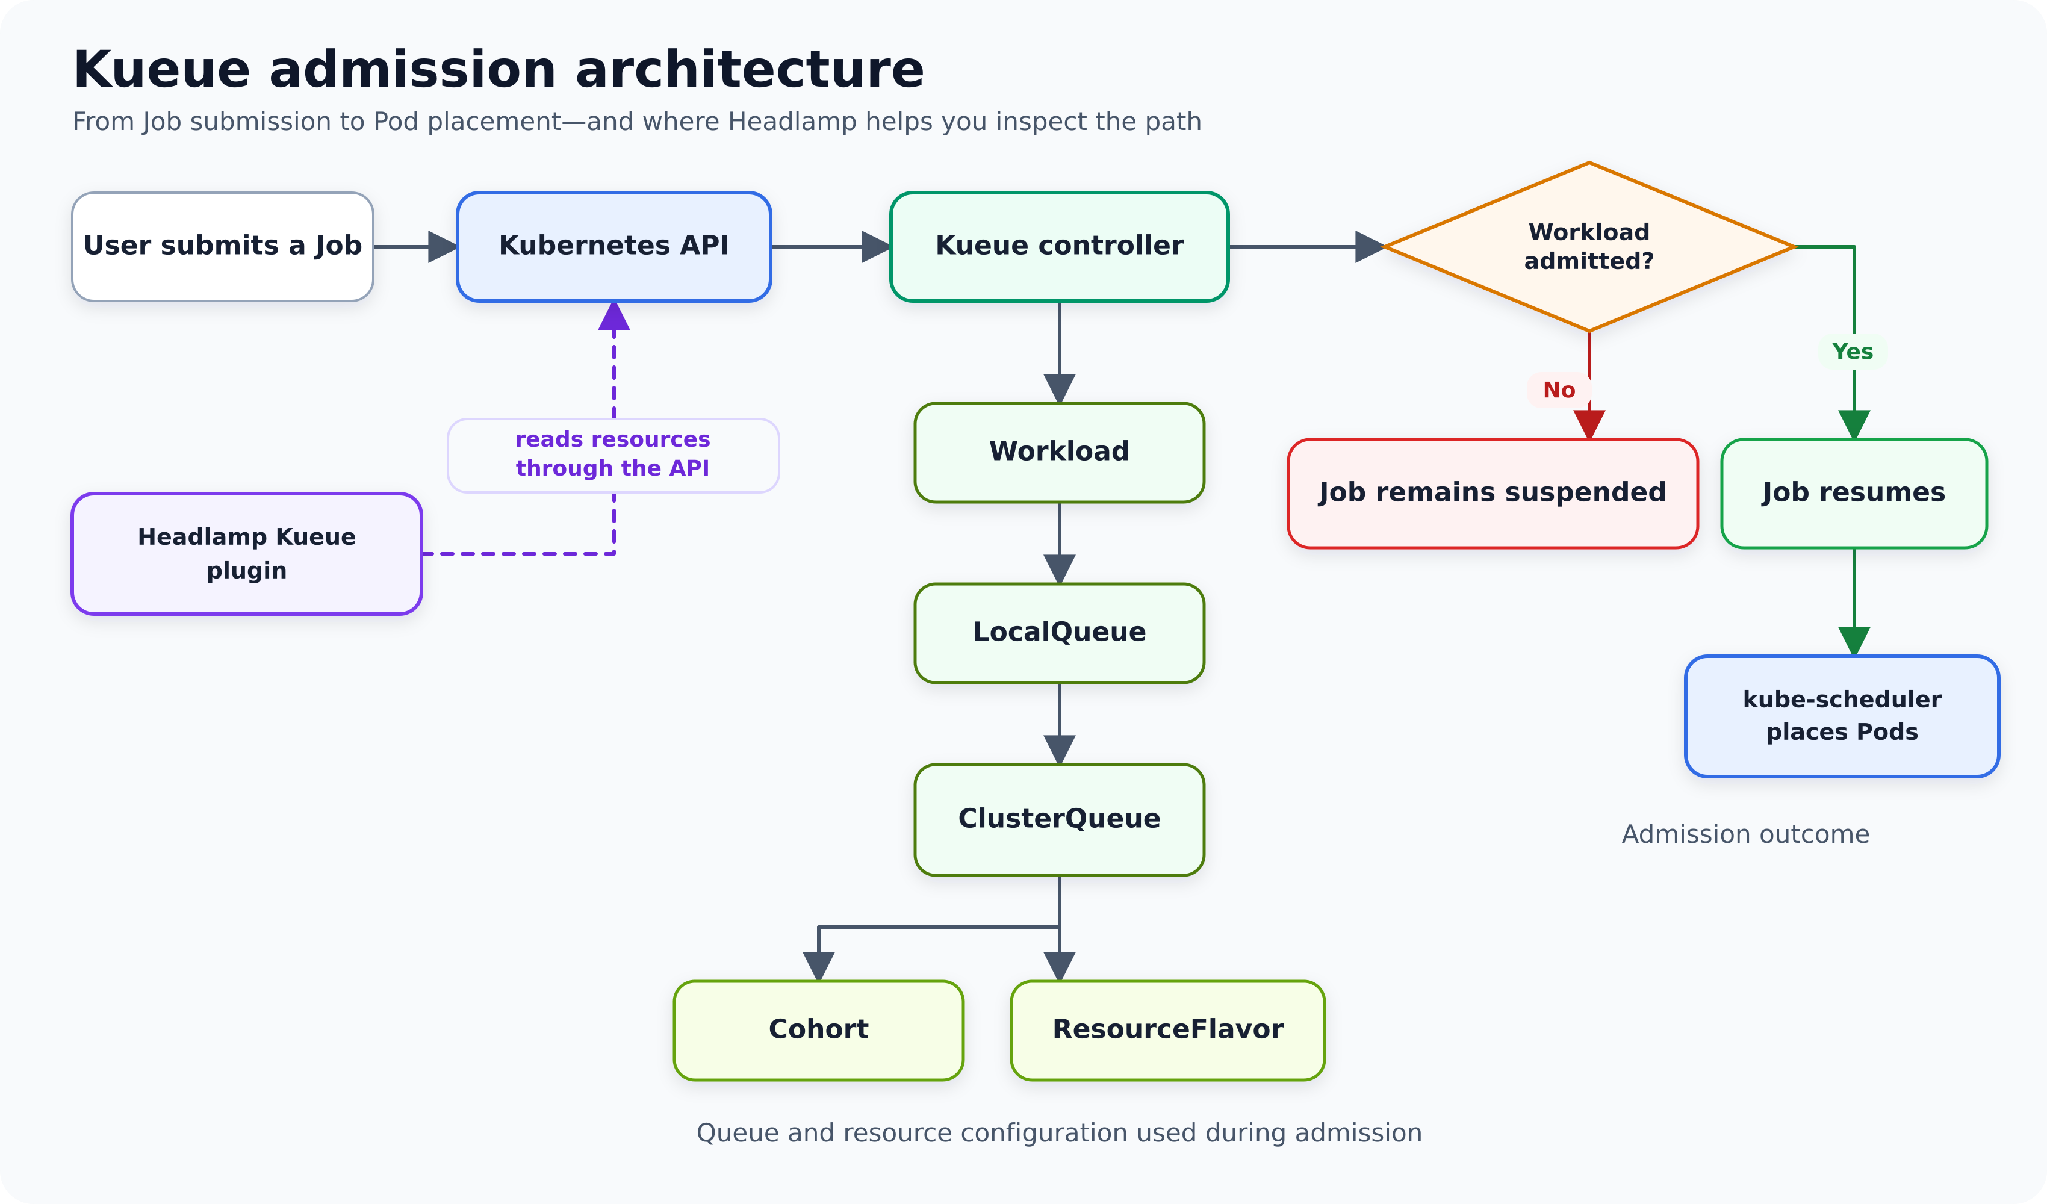
Kueue admission architecture
The Headlamp-first troubleshooting path
The quickest investigation starts with the Workload, not with a shell.
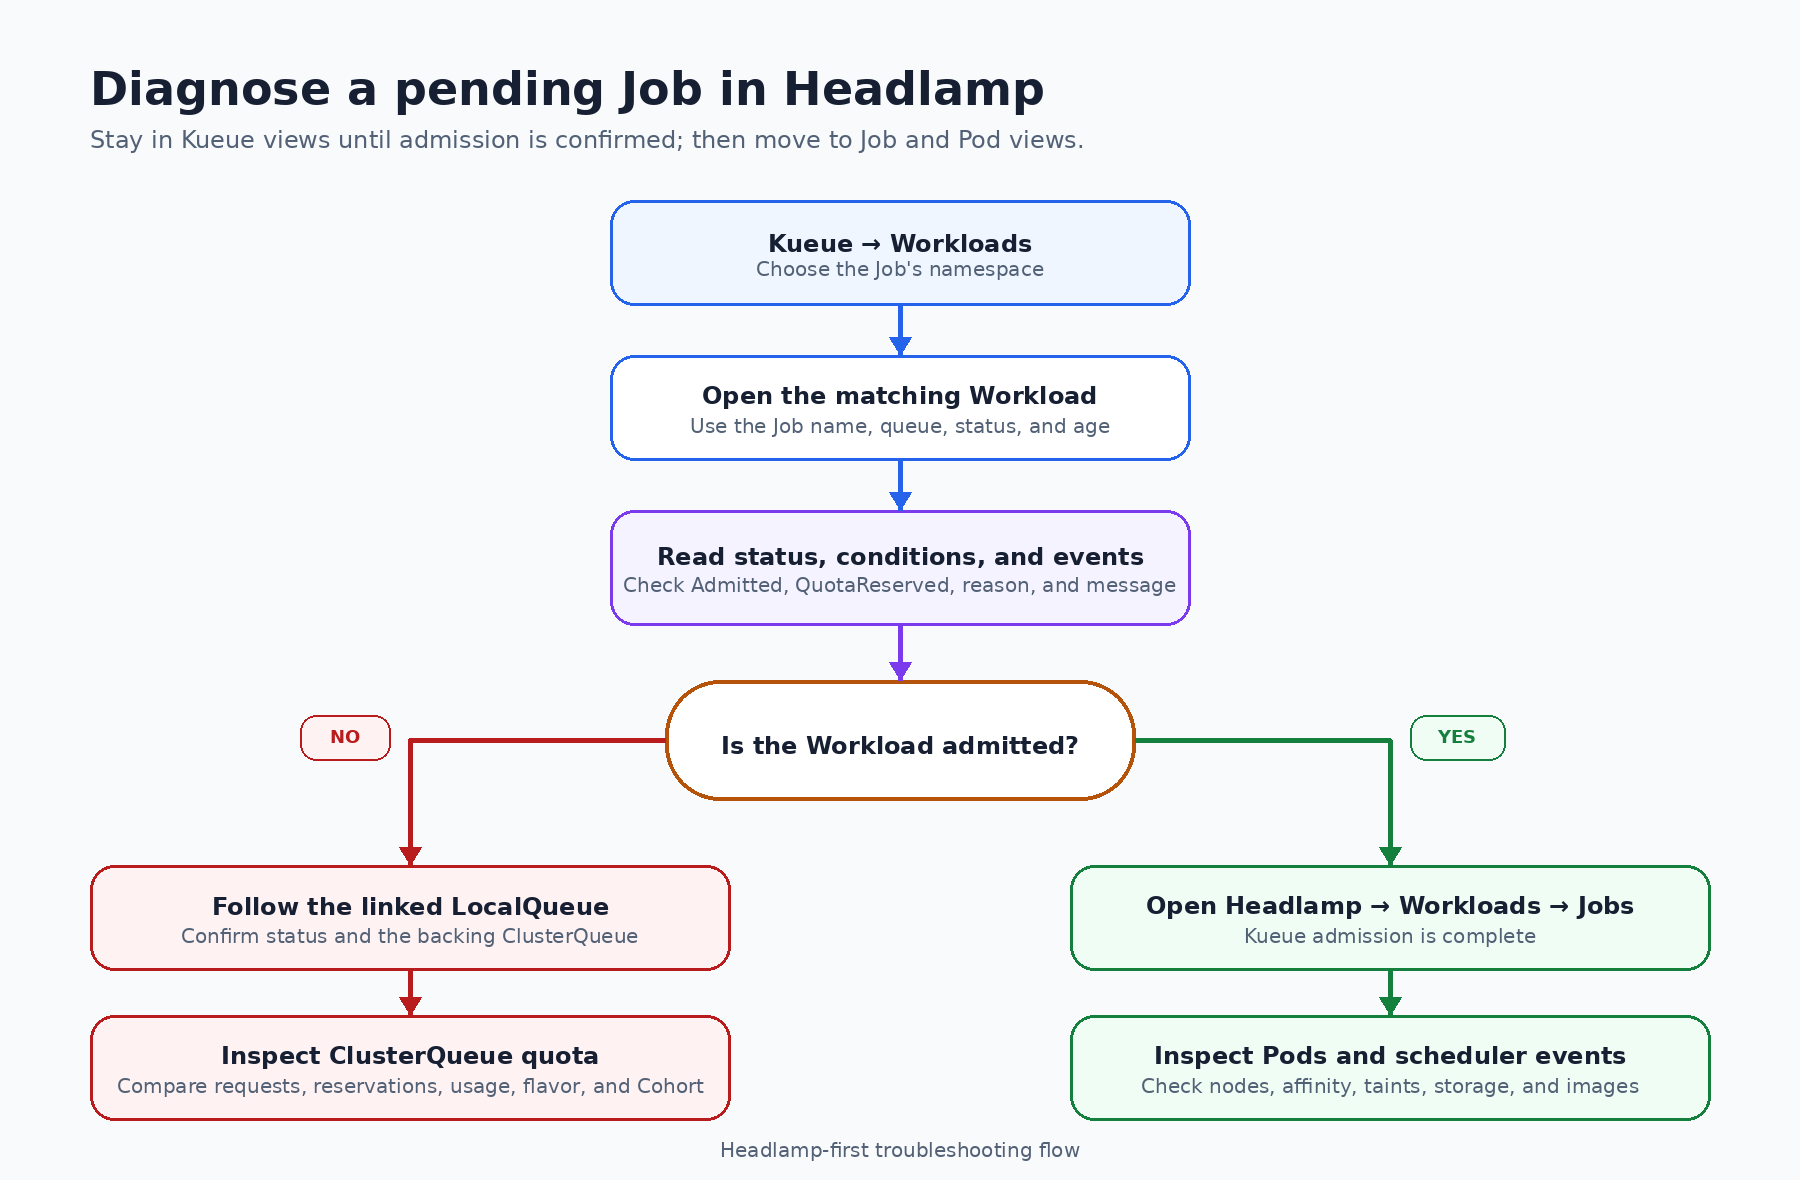
Tracing a pending Job through Headlamp
Step 1: Open the Workloads view
In Headlamp, open Kueue → Workloads. Select the namespace that contains the Job, then find the Workload created for it.
Kueue creates a Workload to represent the resource request and admission state of a Job. In the alpha plugin, owner references are shown as Kind/name text but are not yet clickable. The Workload name normally contains the Job name, so the namespace filter and table search are the simplest ways to locate it.
Before opening the detail page, the list already gives you a useful first scan:
-
LocalQueue
-
priority and priority class
-
active state
-
admitted state
-
completion state
-
a readable current status such as
Admitted,Finished, orInadmissible -
age
If there is no matching Workload, check three things before going further: the selected namespace, whether the Job was submitted to a LocalQueue, and whether your Kubernetes account can list Workloads. The plugin performs permission checks and displays an access message when the current identity cannot read a resource.
Step 2: Read status, conditions, and events
Open the Workload. Start with its current status and conditions, not with the full YAML.
For admission troubleshooting, the most important condition types are QuotaReserved and Admitted.
-
Admitted=Truemeans Kueue has admitted the Workload. The Job can resume, so any remainingPendingPods belong to the scheduling branch of the investigation. -
QuotaReserved=Falsewith a reason such asPendingmeans Kueue has not reserved quota. The condition message explains what prevented the reservation. -
An
Inadmissiblestatus means the Workload currently cannot fit the available queue configuration. A missing covered resource, unsuitable ResourceFlavor, stopped queue, or admission check can all lead you here.
For example, a condition message may report that Kueue could not assign a ResourceFlavor because the ClusterQueue has insufficient CPU quota. That message is the first real answer to "Why is my Job still pending?" The rest of the Headlamp journey explains the configuration behind it.
Also check the Events section. Conditions describe the current state; events help show what recently changed or what Kueue attempted.
Step 3: Compare the Workload's request with its assignment
Stay on the Workload detail page and inspect the PodSets and resource requests. The plugin shows the requested Pod count, CPU, memory, and other resources that Kueue evaluates together.
This matters because a Job with parallelism: 3 and a one-CPU request per Pod asks Kueue for three CPUs in total. Looking at only one Pod's template would underestimate the Workload.
If quota has already been reserved, the same page also shows the assigned ClusterQueue, ResourceFlavors, and admitted resource usage. If those admission assignments are absent, the Workload has not reached that point yet.
In our example, the Workload requests:
-
three Pods
-
three CPUs in total
-
600 MiB of memory in total
The next question is where that request entered Kueue.
Step 4: Follow the linked LocalQueue
Use the LocalQueue link on the Workload detail page. A LocalQueue is the namespace-level entry point used by the Job. It connects namespaced Workloads to a cluster-scoped ClusterQueue.
The LocalQueue page shows:
-
its namespace and connected ClusterQueue
-
stop policy and current status
-
pending, reserving, and admitted Workload counts
-
Kueue conditions and Kubernetes events
-
related Workloads in the same namespace
This page answers two practical questions: Did the Job enter the queue you expected, and is it the only Workload waiting there?
If the LocalQueue is inactive or stopped, that may already explain the wait. If it is active, follow the linked ClusterQueue to inspect the capacity behind it.
Step 5: Inspect ClusterQueue capacity and usage
A ClusterQueue represents the cluster-level quota and admission policy available to one or more LocalQueues.
On its Headlamp detail page, compare the Workload request with:
-
covered resources
-
nominal quota for each ResourceFlavor
-
current reservations and usage
-
borrowing and lending limits
-
pending, reserving, and admitted Workload counts
-
queueing strategy and stop policy
-
preemption, fair-sharing, flavor-fungibility, and admission-check settings
-
Kueue conditions and Kubernetes events
For the example in this article, the ClusterQueue provides a nominal quota of two CPUs and two Pod slots. The Workload asks for three of each. The condition message and the ClusterQueue page now tell the same story: the Workload does not fit, so Kueue leaves the Job suspended.
This is an admission-capacity problem. It is not evidence that kube-scheduler failed to find a node.
Step 6: Check ResourceFlavor and Cohort when needed
Quota is not always a single pool. A ResourceFlavor can represent a class of compute through node labels, taints, tolerations, or topology settings. Use the ResourceFlavor link from the ClusterQueue when the condition mentions flavor assignment or when the Workload requires a particular hardware class, such as GPU nodes.
If the ClusterQueue belongs to a Cohort, follow that link too. Cohorts let ClusterQueues share unused quota. The Headlamp page shows parent and child Cohorts, member ClusterQueues, referenced ResourceFlavors, resource groups, borrowing and lending limits, and fair-sharing information.
These pages help answer a more subtle question: Is the Workload blocked because the queue has no quota of its own, because it cannot borrow enough, or because no suitable flavor can be assigned?
What we learned without leaving Headlamp
For the sample pending Job, the UI gives us a complete explanation:
-
The Workload is not admitted.
-
Its
QuotaReservedcondition is false and the message points to insufficient quota. -
The Workload requests three CPUs and three Pod slots.
-
Its LocalQueue is active and points to the expected ClusterQueue.
-
The ClusterQueue provides only two CPUs and two Pod slots.
-
Kueue therefore keeps the Job suspended until quota becomes available or the queue configuration changes.
The important part is not that Headlamp invents a new status. It reads the same Kubernetes API objects as other clients, then places the related resources and human-readable values in one connected investigation.
If the Workload is admitted, switch views
Suppose the Workload detail page shows Admitted=True, but the application is still not running. Kueue has completed its part of the decision. Continue in Headlamp's standard Kubernetes views:
-
Open Workloads → Jobs and inspect the Job state and events.
-
Open Workloads → Pods and filter by the Job name or namespace.
-
Select a
PendingPod and read its Events section.
At this stage, look for scheduler concerns such as insufficient node capacity, node affinity, taints and tolerations, topology constraints, persistent-volume binding, or image-pull failures.
This handoff is the most useful troubleshooting rule in the article:
-
Not admitted: investigate Kueue resources in Headlamp.
-
Admitted, but Pods arePending: investigate Job, Pod, node, and scheduler information in Headlamp.
A repeatable Headlamp checklist
When the next Job does not start, use this short path:
-
Open Kueue → Workloads and select the correct namespace.
-
Find the Workload associated with the Job.
-
Check the readable status,
Admitted, andQuotaReservedconditions. -
Read the condition message and recent events.
-
Compare PodSet resource requests with any admission assignments.
-
Follow the LocalQueue link and confirm its status and ClusterQueue.
-
Follow the ClusterQueue link and compare quota, reservations, usage, and policy.
-
Inspect ResourceFlavor or Cohort details when the message points to flavor selection or shared quota.
-
If admitted, move to Headlamp's Job and Pod views.
What Headlamp replaces during this investigation
The plugin does not replace kubectl or kueuectl for scripts, exact object output, or changes. It replaces the repetitive UI-less navigation needed during an interactive investigation.
| Question | Headlamp path | Command-line equivalent |
|---|---|---|
| Is the Workload admitted? | Kueue → Workloads → status and conditions | kubectl describe workload <workload-name> -n <namespace> |
| Which LocalQueue did it enter? | Workload → linked LocalQueue | kubectl get localqueue <localqueue-name> -n <namespace> -o yaml |
| Which ClusterQueue provides quota? | LocalQueue → linked ClusterQueue | kubectl get clusterqueue <clusterqueue-name> -o yaml |
| Which flavor or shared quota matters? | ClusterQueue → ResourceFlavor or Cohort | kubectl get resourceflavor <flavor-name> -o yaml or kubectl get cohort <cohort-name> -o yaml |
| What happened after admission? | Workloads → Jobs and Pods → events | kubectl describe job <job-name> -n <namespace> or kubectl describe pod <pod-name> -n <namespace> |
For scripts and GitOps workflows, the command line remains the right tool. For a person asking "why is this waiting?", the linked Headlamp path is usually faster to read.
Optional: reproduce the pending scenario
The plugin repository includes sample Cohort, ClusterQueue, LocalQueue, ResourceFlavor, and Job manifests for local testing. Apply those examples to a cluster where Kueue is installed, then open the Kueue section in Headlamp.
To reproduce the specific quota mismatch used in this article, configure a ClusterQueue with two CPUs and two Pod slots, then submit a three-Pod Job that requests one CPU per Pod. The Job enters its LocalQueue, Kueue creates a Workload, and the Workload remains pending because the combined request is larger than the available quota.
Keeping this setup separate from the main walkthrough is intentional: once the resources exist, the investigation itself should happen in Headlamp.
Current alpha limitations
The 0.1.0-alpha release is an initial read-only view of the Kueue admission path.
-
The plugin does not add its own create, edit, pause, resume, or delete flows.
-
Workload owner references are displayed as text and are not currently navigable.
-
The UI depends on the Kubernetes permissions of the identity used by Headlamp.
-
Metrics and a visual relationship map are possible follow-up areas rather than features of this release.
These limits are useful to state clearly: the plugin's current purpose is to make admission state and resource relationships easier to inspect.
Developed during LFX Mentorship
The plugin was developed during CNCF LFX Mentorship 2026 Term 2 using TypeScript, React, Kubernetes APIs, and Headlamp's plugin system.
Utkarsh Raj implemented the plugin with guidance and review from René Dudfield (@illume) and Kevin Hannon (@kannon92). Feedback from the Headlamp and Kueue communities shaped the resource views, status presentation, navigation, documentation, tests, and first alpha release.
Try it and share feedback
Explore the plugin source and README, read the 0.1.0-alpha release documentation, or share feedback in the release issue.
If a pending Workload is still difficult to explain after following the Headlamp path, that is exactly the kind of feedback that can improve the plugin.
14 Oct 2026 6:35pm GMT
06 Oct 2026
Kubernetes Blog
The Shift to cgroup v2 in Kubernetes: What You Need to Know
In Linux, cgroups (control groups) are a kernel feature used for managing system resources. Kubernetes uses cgroups to allocate resources like CPU and memory to containers, ensuring that applications run smoothly without interfering with each other. With the release of Kubernetes v1.31, support for v1 cgroup management moved into maintenance mode. Support for v2 cgroup management has been stable since Kubernetes v1.25.
Compared with cgroup v1, cgroup v2 provides a single unified hierarchy, a more consistent interface, and a stronger foundation for resource isolation and modern resource-management features.
Deprecation of cgroup v1
Kubernetes has deprecated cgroup v1. Starting with Kubernetes v1.35, failCgroupV1 defaults to true, so the kubelet does not start on a cgroup v1 node by default. Administrators can temporarily set failCgroupV1: false in the kubelet configuration file, but removal will follow the Kubernetes deprecation policy. Further removal work is tracked in KEP-5573: Remove cgroup v1 support.
If you are still on a release older than v1.35, migrate every Linux node to cgroup v2 before upgrading, or plan to set the temporary failCgroupV1: false override. If you are already on v1.35 or later, confirm that every Linux node runs cgroup v2 (or that you intentionally keep the override). Under the default configuration, a remaining cgroup v1 node fails during kubelet startup.
For kubeadm-managed clusters, Kubernetes v1.35 also makes this an earlier, stricter check. The SystemVerification preflight check, provided by k8s.io/system-validators, returns an error during kubeadm init, kubeadm join, and kubeadm upgrade when it detects cgroup v1 with kubelet v1.35 or later; with an older kubelet, the check remains a warning. See kubernetes/system-validators#1.12.1 release notes for details.
The top FAQs cover three main areas: why to migrate, the benefits and drawbacks, and key points to keep in mind when using cgroup v2.
Limitations of cgroup v1 and Improvements with cgroup v2
The Linux kernel documentation describes both interfaces:
Let's enumerate some known issues.
active_file memory is not considered available memory
The kubelet treats active_file memory as not reclaimable. For I/O-intensive workloads, a large page cache can therefore make the kubelet report memory pressure and evict Pods. This is a known kubelet issue (kubernetes/kubernetes#43916); migrating to cgroup v2 does not by itself change that calculation. The documented workaround is to set equal memory requests and limits for containers that perform intensive I/O, after measuring an appropriate value.
Memory QoS updates in Kubernetes v1.36
Memory QoS was introduced as an alpha feature in Kubernetes v1.22 and updated in v1.27. It remains alpha in v1.36, but now separates memory throttling from memory reservation and adds tiered memory protection:
Memory QoS is available only on Linux nodes that use cgroup v2. It relies on the cgroup v2 memory controller: memory.high provides throttling, while memory.min and memory.low provide hard and soft protection when tiered reservation is enabled. cgroup v1 cannot provide this protection model.
-
Enabling the
MemoryQoSfeature gate appliesmemory.highthrottling to Burstable containers. The threshold is derived from the request, limit, andmemoryThrottlingFactor(default0.9). -
memoryReservationPolicy: Noneis the default. It does not writememory.minormemory.low. -
memoryReservationPolicy: TieredReservationmaps Guaranteed Pod memory requests tomemory.min(hard protection) and Burstable Pod requests tomemory.low(soft protection). BestEffort Pods receive neither protection. -
The kubelet exposes Alpha metrics for the total
memory.minandmemory.lowreservations on a node. -
Kernel 5.9 or later is recommended. On older kernels,
memory.highreclaim can trigger a known livelock; from v1.36 the kubelet logs a warning when Memory QoS is enabled on an affected kernel.
For example, to opt in to tiered protection:
apiVersion: kubelet.config.k8s.io/v1beta1
kind: KubeletConfiguration
featureGates:
 MemoryQoS: true
memoryReservationPolicy: TieredReservation
memoryThrottlingFactor: 0.9
The overall Kubernetes recommendation is not to enable Alpha features in production; however, if you judge that memory QoS with tiered reservations is useful for your platform in production, make sure to test the configuration and account for hard-reserved memory before you enable the TieredReservation feature gate. See the Pod QoS documentation for the current mapping of Kubernetes QoS classes to cgroup v2 controls.
Container-aware OOM handling
On cgroup v2 nodes, the kubelet defaults singleProcessOOMKill to false. It therefore sets memory.oom.group for each container cgroup so that an OOM event kills all processes in that container together, rather than leaving a partially functioning multi-process container. Set singleProcessOOMKill: true only if you need the cgroup v1-compatible behavior where the kernel may kill one process at a time. See the KubeletConfiguration reference for this setting.
This behavior is scoped to a container cgroup, not the whole Pod. Also, cgroup.kill is a separate administrative interface: writing 1 to it sends SIGKILL to every process in that cgroup and its descendants; it does not configure OOM behavior. The cgroup v2 memory controller additionally provides memory.events counters that monitoring systems and userspace OOM managers can observe.
Rootless support
In cgroup v1, delegating controllers to less privileged containers may be dangerous.
Unlike cgroup v1, cgroup v2 officially supports delegation. Most implementations of rootless containers rely on systemd for delegating v2 controllers to non-root users.
This delegation mechanism is separate from Kubernetes Pod user namespaces, which map container users to unprivileged host users. Pod user namespace support graduated to stable in Kubernetes v1.36; check its filesystem, kernel, CRI runtime, and OCI runtime prerequisites before enabling it.
What else?
- eBPF stories:
- In cgroup v1, device access controls are exposed through interface files.
- The cgroup v2 device controller has no interface files, and is implemented on top of cgroup BPF.
- Cilium attaches BPF cgroup programs for socket-based load balancing. Its default cgroup root is
/run/cilium/cgroupv2.
- Pressure Stall Information (PSI) reports CPU, memory, and I/O contention at node, Pod, and container level. On supported clusters, the kubelet exposes PSI by default (
KubeletPSIis stable and locked on). PSI requires cgroup v2, Linux 4.20 or later,CONFIG_PSI=y, and a kernel not booted withpsi=0. The kubelet surfaces the data through the Summary API and/metrics/cadvisor. - When migrating, update software that reads the cgroup filesystem directly. The migration guidance recommends cAdvisor v0.43.0 or later and lists compatible Java, Node.js, and
automaxprocsversions.
CPU weight conversion in newer OCI runtimes
cgroup v1 uses cpu.shares, whereas cgroup v2 uses cpu.weight. Newer OCI runtimes use an improved non-linear conversion that preserves the default priority and gives small CPU requests more usable granularity. The change is implemented in the OCI runtime rather than Kubernetes: it is available in crun v1.23 and runc v1.3.2. After upgrading a runtime, monitoring or policy tools that predict exact cpu.weight values may need updates. Read New Conversion from cgroup v1 CPU Shares to v2 CPU Weight for the formula, examples, and compatibility considerations.
In-place resource updates
In-place Pod vertical scaling graduated to stable in Kubernetes v1.35. Kubernetes v1.36 then [enabled] (/blog/2026/04/30/kubernetes-v1-36-inplace-pod-level-resources-beta/) in-place vertical scaling for Pod-level resources by default, as a Beta feature. The kubelet coordinates changes between the Pod-level and container cgroups so that increases create headroom before container limits grow, while decreases constrain containers before shrinking the Pod-level boundary. Accurate aggregate enforcement for this v1.36 feature requires cgroup v2.
Adopting cgroup version 2
Requirements
Here's what you need to use cgroup v2 with Kubernetes. First up, you need to be using a version of Kubernetes with support for v2 cgroup management; that's been stable since Kubernetes v1.25 and all supported Kubernetes releases include this support.
- You need at least one Linux node; cgroup is a Linux-only concept
- Your OS install must run with cgroup v2 enabled
- The kernel version must be 5.8 or later (5.9 or later is recommended when using memory QoS)
- The container runtime must support cgroup v2. For example:
- containerd v1.4 or later supports cgroup v2; use containerd v2.0 or later for automatic cgroup-driver discovery
- CRI-O v1.20 or later
- The kubelet and the container runtime must both be configured to use the correct cgroup driver. See Configure the kubelet's cgroup driver to match the container runtime cgroup driver.
For now, you can opt back in to use cgroup v1; the Kubernetes project recommends using cgroup v2, but in Kubernetes 1.36 (the current release) the cgroup v1 option remains supported as a fallback. That fallback is scheduled for removal in Kubernetes v1.38. If you are running an older cluster, plan to migrate; if you are setting up a new cluster with Linux nodes, you should prefer cgroup v2. In either case, review both the Kubernetes runtime documentation and (if relevant) the containerd compatibility matrix.
kernel updates around cgroup v2
When Kubernetes was first announced, in 2014, only v1 cgroup existed. Version 2 cgroup management first appeared in Linux kernel 4.5, released in 2016.
- In Linux 4.5, the cgroup v2
io,memory, andpidscontrollers were supported. - Linux 4.15 added support for the cgroup v2
cpucontroller. - Pressure Stall Information (PSI) support began with Linux 4.20.
- The Kubernetes project does not recommend using cgroup v2 with a Linux kernel older than 5.2 due to lack of cgroup-level task freezer support.
- Kubernetes documents 5.8 as the minimum kernel version for cgroup v2; the root cgroup's system-level
cpu.statfile was added in Linux 5.8. - The
memory.highlivelock fix used by Memory QoS is present in Linux 5.9 and later. memory.peakwas added in Linux 5.19.
cgroup driver configuration
Configure the kubelet's cgroup driver to match the container runtime cgroup driver.
If you use kubeadm to manage your cluster, Kubernetes recommends that you use the systemd cgroup driver, because kubeadm manages the kubelet as a systemd service. For other management tooling, check the documentation for the tool you're using to manage your cluster.
If you can pick either option, I recommend using the systemd driver.
Whatever tooling you've chosen, the kubelet automatically tries to detect the runtime's recommended cgroup driver. This automatic detection relies on using a runtime that implements the RuntimeConfig CRI RPC (for example: containerd v2.0+ or CRI-O v1.28+).
If you're using a container runtime that supports cgroup v2 but doesn't support automatic cgroup driver detection, you can manually configure an override by editing the kubelet configuration file. For example:
apiVersion: kubelet.config.k8s.io/v1beta1
kind: KubeletConfiguration
cgroupDriver: systemd
Automatic discovery of the runtime's cgroup driver through the CRI, tracked by KEP-4033, graduated to stable in Kubernetes v1.34. It requires a runtime that implements the RuntimeConfig CRI RPC (containerd v2.0+ or CRI-O v1.28+). When available, the kubelet uses the value reported by the runtime instead of its configured cgroupDriver value.
Tools and commands for troubleshooting
Tools and commands that you should know about cgroups:
stat -fc %T /sys/fs/cgroup/: Check whether cgroup v2 is enabled; it returnscgroup2fs.systemctl list-units 'kube*' --type=sliceor--type=scope: List Kubernetes-related units that systemd currently has in memory.bpftool cgroup list /sys/fs/cgroup/*: List all programs attached to the cgroup CGROUP.systemd-cgls /sys/fs/cgroup/*: Recursively show control group contents.systemd-cgtop: Show top control groups by their resource usage.tree -L 2 -d /sys/fs/cgroup/kubepods.slice: Show Pods' related cgroups directories.
How to check if a Pod CPU or memory limit is successfully applied to the cgroup file?
Work from the API object down to the node. Identify the node, then compare desired resources in the spec with the enacted values in status (in-place resize can leave those out of sync):
kubectl get pod <pod-name> -n <namespace> \
 -o jsonpath='{.spec.nodeName}{"\n"}'

kubectl get pod <pod-name> -n <namespace> \
 -o jsonpath='{range .spec.containers[*]}{.name}{" spec\t"}{.resources}{"\n"}{end}'

kubectl get pod <pod-name> -n <namespace> \
 -o jsonpath='{range .status.containerStatuses[*]}{.name}{" status\t"}{.resources}{"\n"}{end}'
On that node, as root, with the systemd cgroup driver and cgroup v2 (these snippets also need jq). Pin the container with kubelet labels; a container name alone is not unique on a node. Use crictl ps -a if the container is not running:
CONTAINER_ID=$(crictl ps \
 --label io.kubernetes.pod.namespace=<namespace> \
 --label io.kubernetes.pod.name=<pod-name> \
 --name <container-name> -q | head -n1)

# OCI view (not the CRI protobuf field names)
crictl inspect "$CONTAINER_ID" | jq '.info.runtimeSpec.linux.resources'

# Kernel cgroup path for this container
PID=$(crictl inspect "$CONTAINER_ID" | jq -r '.info.pid')
CGROUP="/sys/fs/cgroup$(awk -F: '$1=="0"{print $3}' /proc/$PID/cgroup)"

cat "$CGROUP/cpu.weight" # request.cpu → shares → weight; not a limit
cat "$CGROUP/cpu.max" # limit.cpu as "quota period"; unlimited is "max <period>"
cat "$CGROUP/memory.max" # limit.memory; unlimited is "max"

# Pod-level cgroup (parent slice), used by Pod-level resources
cat "$(dirname "$CGROUP")/cpu.max" "$(dirname "$CGROUP")/memory.max"

# Present when MemoryQoS is enabled
cat "$CGROUP/memory.high" "$CGROUP/memory.min" "$CGROUP/memory.low"

SCOPE=$(basename "$CGROUP")
systemctl show "$SCOPE" \
 -p CPUWeight -p CPUQuotaPerSecUSec -p CPUQuotaPeriodUSec -p MemoryMax
Do not treat info.runtimeSpec.linux.cgroupsPath as a filesystem path when the runtime uses the systemd driver; that value is a systemd unit path (slice:runtime:id), not a directory under /sys/fs/cgroup.
Expected mapping at each layer:
- Kubernetes:
spec.containers[*].resources(desired) andstatus.containerStatuses[*].resources(enacted after in-place resize). Pod-level resources are onspec.resourcesand the parent pod slice. - CRI (kubelet → runtime; these protobuf names stay cgroup v1-style even on v2):
cpu_shares,cpu_quota,cpu_period,memory_limit_in_bytes, plusunifiedfor Memory QoS.crictl inspectdoes not show these names; it shows the OCI spec the runtime derived from them. - OCI spec:
linux.resources.cpu.{shares,quota,period},linux.resources.memory.limit, andlinux.resources.unified. The runtime converts shares, quota, and period into cgroup v2 files. After upgrading crun or runc, the shares-to-weight formula may change; see CPU weight conversion. - systemd scope:
CPUWeight,CPUQuotaPerSecUSec,CPUQuotaPeriodUSec,MemoryMax. Unlimited or unset values often appear as[not set]or infinity. - cgroupfs:
cpu.weight(from CPU request; an unset request still yields the default of 2 shares),cpu.max, andmemory.maxon the container scope. Memory QoS addsmemory.high,memory.min, andmemory.low.
Further reading
- Kubernetes 1.31: Moving cgroup v1 Support into Maintenance Mode
- Kubernetes v1.36: Tiered Memory Protection with Memory QoS
- Kubernetes v1.36: PSI Metrics for Kubernetes Graduates to GA
- Kubernetes 1.25: cgroup v2 graduates to GA
- KubeCon NA 2022 cgroup v2: Before You Jump In by Tony Gosselin & Mike Tougeron, Adobe Systems
- KubeCon NA 2022 Cgroupv2 Is Coming Soon To a Cluster Near You - David Porter, Google & Mrunal Patel, RedHat
- KubeCon EU 2020 Kubernetes On cgroup v2 by Giuseppe Scrivano, Red Hat.
- This blog only covers the basic requirements and configuration of Kubernetes components. It will not include how to enable cgroup fs in OS distributions. For migration, you can refer to migrating cgroup v2
06 Oct 2026 6:00pm GMT
05 Oct 2026
Kubernetes Blog
Scaling Kubernetes Workloads with Node Swap
Memory is often the first hard limit a Kubernetes cluster hits. Nodes run out of RAM long before they run out of CPU, and the new wave of agentic AI workloads makes this worse. These workloads demand large memory footprints to start up and run untrusted code, then sit idle waiting for the next prompt. That idle but resident memory is expensive, and it caps how many pods a node can hold. This is where swap helps. Kubernetes support for running nodes with swap enabled reached General Availability in v1.34, and by backing that swap with fast NVMe solid state drives (SSDs), a node can page out dormant memory and pack in far more pods. This post explains how we benchmarked that approach across three workloads, including CI/CD kernel builds, sandboxed headless browsers, and isolated Python runtimes; we found density gains of up to 3×, often with little or no latency cost.
The node density problem
The Kubernetes ecosystem has reached a fundamental physical resource constraint: the strict limits of hardware memory versus the growing demand for dynamic, bursty workloads in the new agentic era.
Historically, administrators provisioning memory-intensive workloads encountered a persistent dilemma: set memory limits too high and you waste expensive infrastructure on idle RAM; set them too low and you risk Out-Of-Memory (OOM) kills.
This conflict is amplified when deploying autonomous AI agents using secure execution environments like the agent-sandbox framework. These agentic pods require large memory footprints to initialize and execute untrusted code. However, after their burst of activity, they typically enter long-tail idle phases waiting for user prompts. Keeping this idle state in physical RAM caps cluster density and makes AI infrastructure expensive to run.
The solution: Kubernetes node swap
With the introduction of Kubernetes' support for running nodes with swap enabled (which reached General Availability in v1.34), this paradigm shifts. By enabling the Linux kernel to page out anonymous memory to disk, node swap acts as a shock absorber during traffic spikes or periods of heavy memory oversubscription.
Historically, swap was discouraged in Kubernetes for two reasons. The first was memory accounting. Under cgroup v1, the controls treated memory and swap as a single combined limit rather than letting operators set an independent limit for disk swap. Without independent tracking, a process could page large amounts of anonymous memory out to disk, which made a container's real memory usage unpredictable and hard to isolate. Kubernetes' swap support resolves this by relying on cgroup v2, whose separate swap accounting tracks disk swap on its own. The second reason was the latency penalty of paging to slow spinning disks, which fast NVMe Local SSDs largely eliminate. Together, these make it practical to increase pod density and buffer against memory spikes without sacrificing cluster stability.
The benchmark data
To quantify the performance boundaries and cost-saving potential of Local SSD-backed node swap, this analysis covers three distinct workload categories: a Traditional Build Workload for CI/CD pipelines, High-Density Browser Sandboxes, and Isolated Python Sandboxes.
| Workload Profile | Baseline Capacity (No Swap) | Local SSD Swap Capacity | Density Improvement |
|---|---|---|---|
| Linux CI/CD Kernel Build | 600 MB RAM Limit | 300 MB RAM Limit | -50% RAM Footprint |
| Headless Chrome (Kata) | 40 Concurrent Pods | 50 Concurrent Pods | +25% Pod Density |
| Headless Chrome (gVisor) | 80 Concurrent Pods | 160 Concurrent Pods | +100% Pod Density |
| Python Sandbox (gVisor) | 80 Concurrent Pods | 240 Concurrent Pods | +200% Pod Density |
1. Traditional workload: Linux kernel build
Before exploring specialized agentic architectures, swap was validated against classic batch workloads by running a complete Linux 6.1.1 kernel build. The kernel compilation process leverages concurrent worker threads, balloons in memory to hold compiled object files, and requires a large memory spike during the brief linking phase.
This workload mirrors the memory behavior of enterprise CI/CD pipelines. Because earlier compiled objects sit inactive in memory while the pipeline progresses, CI/CD jobs frequently hoard unused physical RAM, which makes them well suited to node swap compression.
On a baseline node without swap, the minimum memory limit to prevent an OOM crash during compilation was 600 MB. Routing swap to a Local SSD cut the container memory limit by 50% to 300 MB without incurring any execution slowdown (in fact, it ran cleanly in 374s vs the baseline 433s). However, as an explicit tradeoff, compressing the limit further to 200 MB forced the active working set into swap, causing long I/O wait times and increasing execution time by over 40%. This reinforces that swap serves as an insurance policy for burst memory, not a replacement for active RAM.
2. High-density agent workloads: headless browser runtimes
AI agent workloads frequently require manipulating headless browsers via Chromium. However, trusting external code execution often requires stricter security isolation than standard Linux namespaces. This benchmark cross-evaluated several container runtime environments. The raw logs and testing methodologies for the default runtime are available in the Agent Sandbox GKE Swap directory.
- Unsandboxed baseline limits (
runc): To test the limits of the environment without the overhead of security runtimes, plain runc containers were swept on a c4-standard-32 node (32 vCPU, 120 GB RAM). Without swap, the node exhausted physical memory and failed past 512 pods. Enabling Local SSD swap allowed the node to support 768 concurrent pods. - Advanced security runtimes (for example: gVisor, Kata Containers): Enabling strict security sandboxing increases memory overhead and normally reduces pod density. However, memory swap naturally absorbs this overhead penalty. Without swap, a gVisor environment hit a hard limit at 80 pods. Local SSD swap doubled that capacity, which allowed 160 concurrent gVisor pods on a single node. Similarly, Kata Containers microVMs exhausted physical RAM at 40 concurrent pods without swap, but using GCP Local SSD swap expanded this to 50 stable Kata microVMs before CPU saturation.
At these maximum densities, the per-pod latency increase is driven mainly by pods competing for CPU, not by swap I/O. An operator tuning for a specific latency target would run at a lower density than the peak numbers here and see a proportionally smaller latency cost.
For a comprehensive architectural breakdown and density metrics for gVisor and Kata, see the Agent Sandbox GKE Swap Runtimes directory.
3. Beyond browsers: sandboxed Python runtimes
The advantages of node swap also extend to untrusted, isolated code-execution environments. This sweep deployed simultaneous Python sandbox sessions analyzing 5 million rows of data from the MovieLens 20M dataset, requiring a ≃375 MiB resident memory footprint per execution. The in-depth scaling results and deployment code for this sweep can be reviewed in the Agent Sandbox GKE Swap Python Density directory.
Without swap, heavy concurrent bursts exhausted physical memory, causing the node to hit a hard RAM limit and fail at 80 concurrent sessions. Enabling Local SSD swap offloaded dormant anonymous memory, freeing up physical RAM and preserving the node's page cache. This allowed the node to scale to 240 concurrently isolated Python sandboxes-a 3× density improvement. As with the browser workloads, the latency rise at peak density comes mainly from the sandboxes competing for CPU rather than from swap itself.
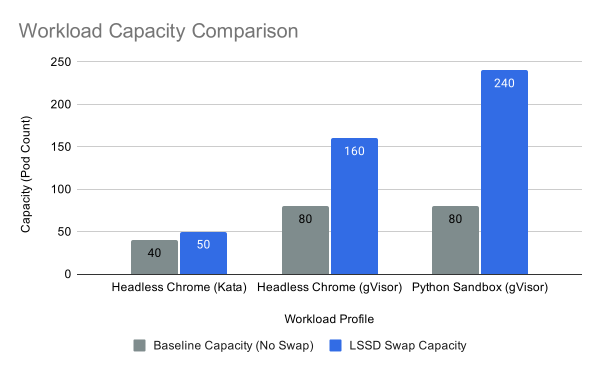
Density Benchmarks with and without Node Swap
How to use it
If you manage Kubernetes infrastructure for developer environments, browser testing farms, JVM applications, or AI execution runtimes, leveraging Local SSD swap can multiply your density efficiency.
In Kubernetes v1.34+, node swap is Generally Available. You enable it via the kubelet configuration:
kind: KubeletConfiguration
apiVersion: kubelet.config.k8s.io/v1beta1
failSwapOn: false
memorySwap:
 swapBehavior: LimitedSwap
Pairing this upstream configuration with your cloud provider's high-speed local disk gives you dynamic memory balancing. For example, this is natively supported on Google Kubernetes Engine via Node Memory Swap configured on Local SSD profiles.
To get the benefits, configure your workloads with Burstable QoS: set your container's memory limits higher than its requests. The node automatically rations fast swap space based on idle application memory usage while keeping active processes responsive.
Conclusion
As the Kubernetes ecosystem transitions into the agentic era, administrators face a growing conflict between finite hardware memory limits and the bursty behavior of AI workloads. Frameworks like Agent Sandbox provide the security isolation required for running untrusted agents, but that isolation traditionally demands large amounts of idle memory overhead.
By configuring the kubelet with LimitedSwap and routing it to Local SSDs, you can mitigate this conflict. Fast swap offloads the dormant states of idle agents, allowing you to increase pod density and node utilization on the same infrastructure without compromising security boundaries.
05 Oct 2026 6:00pm GMT