22 Jan 2026
 Kubernetes Blog
Headlamp in 2025: Project Highlights
This announcement is a recap from a post originally published on the Headlamp blog.
Headlamp has come a long way in 2025. The project has continued to grow - reaching more teams across platforms, powering new workflows and integrations through plugins, and seeing increased collaboration from the broader community.
We wanted to take a moment to share a few updates and highlight how Headlamp has evolved over the past year.
Updates
Joining Kubernetes SIG UI
This year marked a big milestone for the project: Headlamp is now officially part of Kubernetes SIG UI. This move brings roadmap and design discussions even closer to the core Kubernetes community and reinforces Headlamp's role as a modern, extensible UI for the project.
As part of that, we've also been sharing more about making Kubernetes approachable for a wider audience, including an appearance on Enlightening with Whitney Lee and a talk at KCD New York 2025.
Linux Foundation mentorship
This year, we were excited to work with several students through the Linux Foundation's Mentorship program, and our mentees have already left a visible mark on Headlamp:
- Adwait Godbole built the KEDA plugin, adding a UI in Headlamp to view and manage KEDA resources like ScaledObjects and ScaledJobs.
- Dhairya Majmudar set up an OpenTelemetry-based observability stack for Headlamp, wiring up metrics, logs, and traces so the project is easier to monitor and debug.
- Aishwarya Ghatole led a UX audit of Headlamp plugins, identifying usability issues and proposing design improvements and personas for plugin users.
- Anirban Singha developed the Karpenter plugin, giving Headlamp a focused view into Karpenter autoscaling resources and decisions.
- Aditya Chaudhary improved Gateway API support, so you can see networking relationships on the resource map, as well as improved support for many of the new Gateway API resources.
- Faakhir Zahid completed a way to easily manage plugin installation with Headlamp deployed in clusters.
- Saurav Upadhyay worked on backend caching for Kubernetes API calls, reducing load on the API server and improving performance in Headlamp.
New changes
Multi-cluster view
Managing multiple clusters is challenging: teams often switch between tools and lose context when trying to see what runs where. Headlamp solves this by giving you a single view to compare clusters side-by-side. This makes it easier to understand workloads across environments and reduces the time spent hunting for resources.
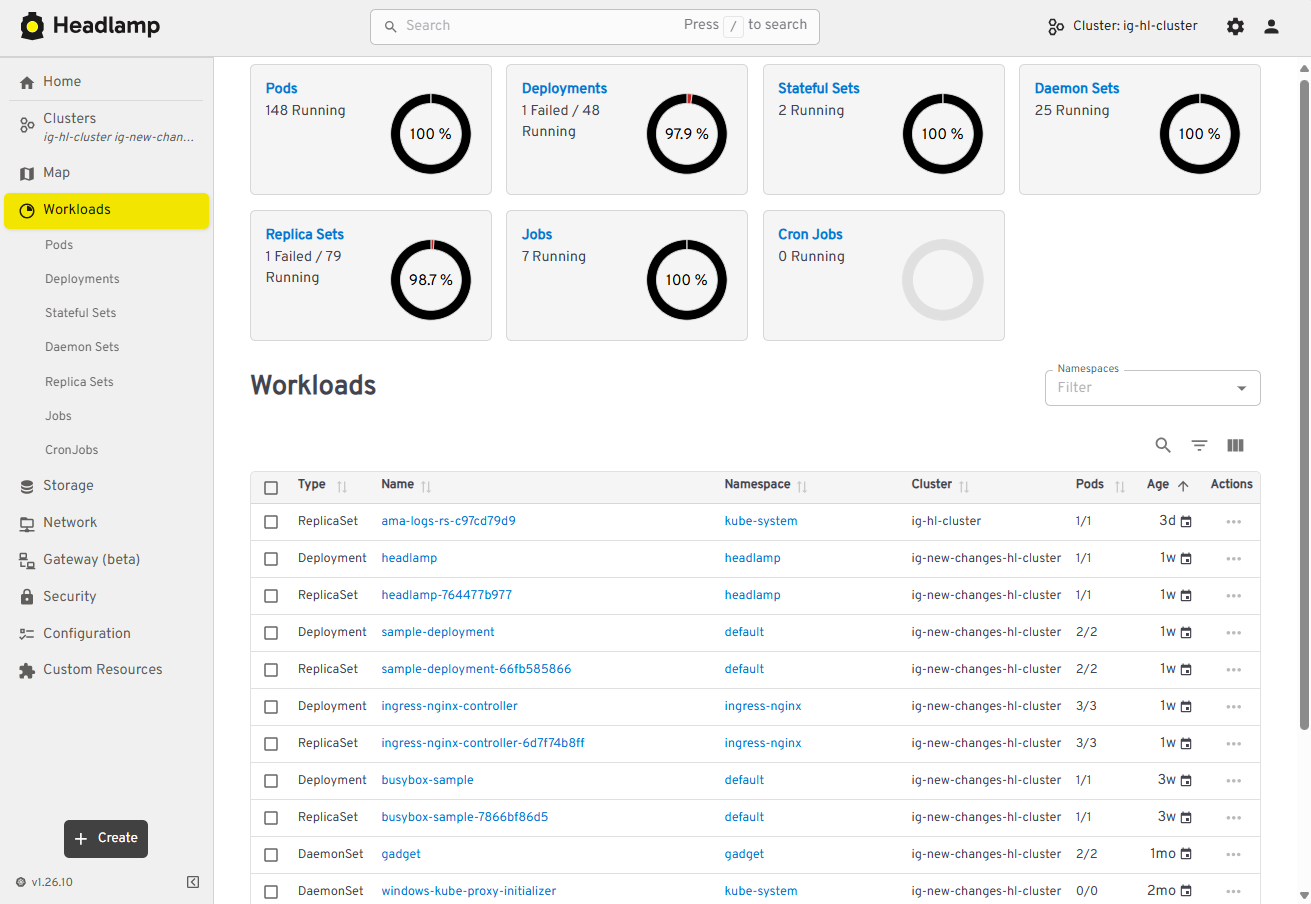 View of multi-cluster workloads
Projects
Kubernetes apps often span multiple namespaces and resource types, which makes troubleshooting feel like piecing together a puzzle. We've added Projects to give you an application-centric view that groups related resources across multiple namespaces - and even clusters. This allows you to reduce sprawl, troubleshoot faster, and collaborate without digging through YAML or cluster-wide lists.
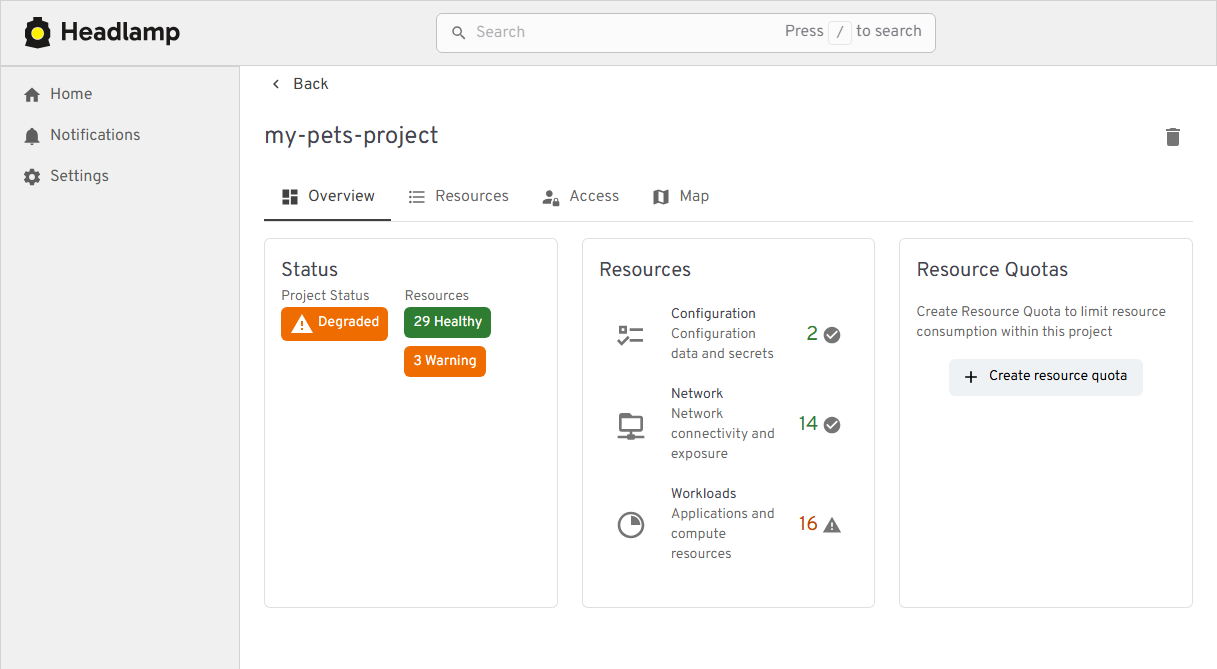 View of the new Projects feature
Changes:
- New "Projects" feature for grouping namespaces into app- or team-centric projects
- Extensible Projects details view that plugins can customize with their own tabs and actions
Navigation and Activities
Day-to-day ops in Kubernetes often means juggling logs, terminals, YAML, and dashboards across clusters. We redesigned Headlamp's navigation to treat these as first-class "activities" you can keep open and come back to, instead of one-off views you lose as soon as you click away.
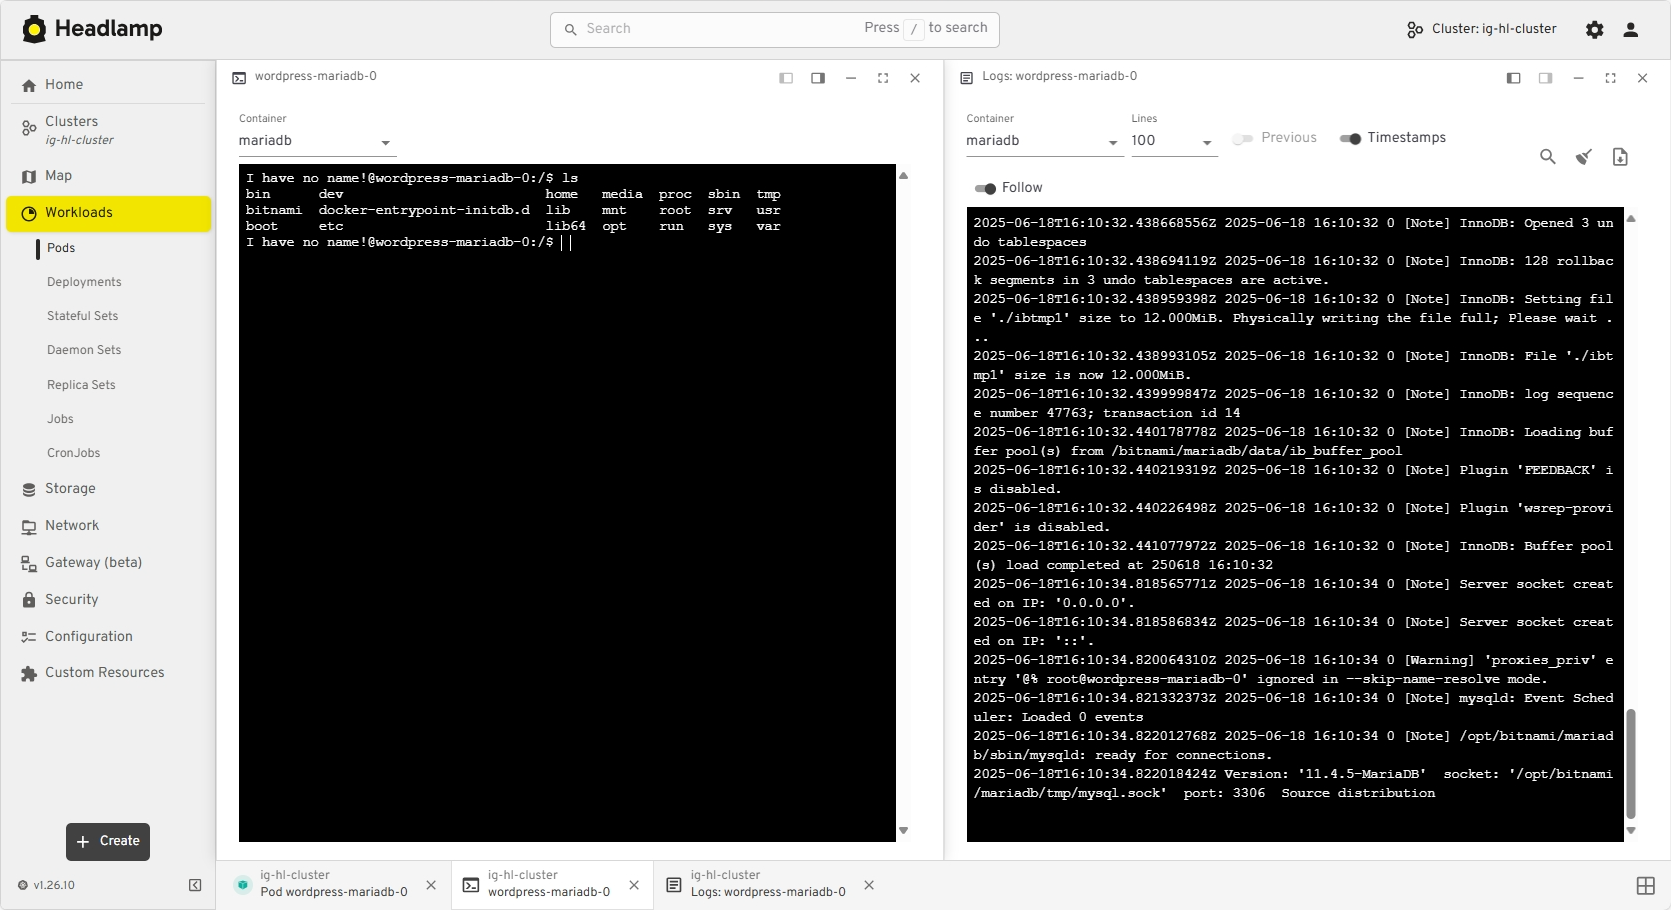 View of the new task bar
Changes:
- A new task bar/activities model lets you pin logs, exec sessions, and details as ongoing activities
- An activity overview with a "Close all" action and cluster information
- Multi-select and global filters in tables
Thanks to Jan Jansen and Aditya Chaudhary.
Search and map
When something breaks in production, the first two questions are usually "where is it?" and "what is it connected to?" We've upgraded both search and the map view so you can get from a high-level symptom to the right set of objects much faster.
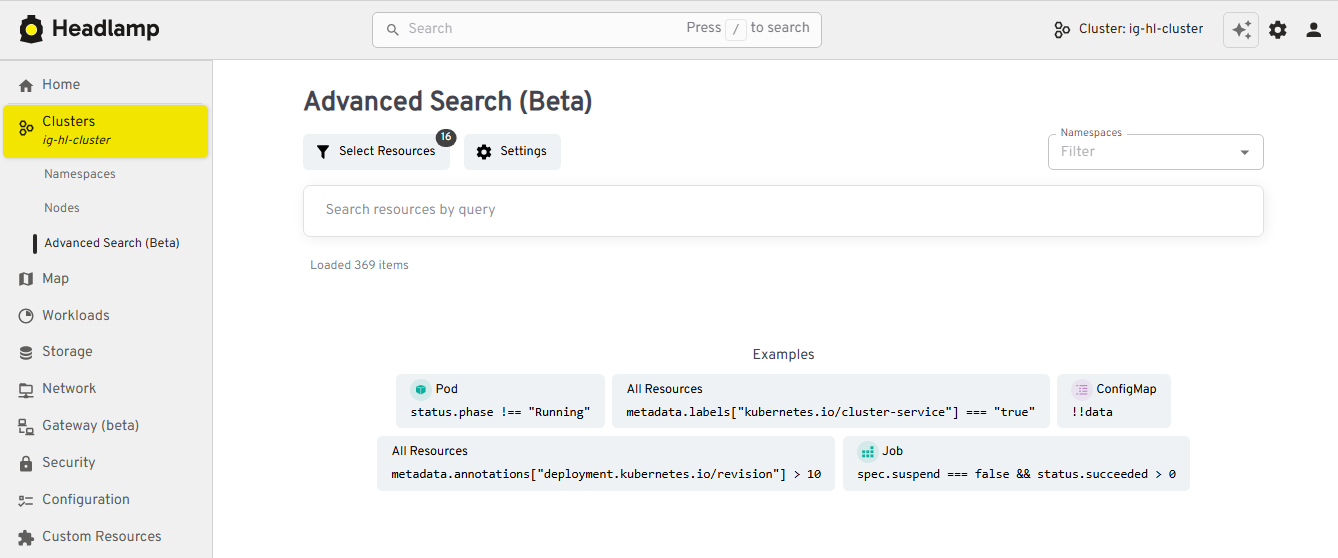 View of the new Advanced Search feature
Changes:
- An Advanced search view that supports rich, expression-based queries over Kubernetes objects
- Improved global search that understands labels and multiple search items, and can even update your current namespace based on what you find
- EndpointSlice support in the Network section
- A richer map view that now includes Custom Resources and Gateway API objects
Thanks to Fabian, Alexander North, and Victor Marcolino from Swisscom, and also to Aditya Chaudhary.
OIDC and authentication
We've put real work into making OIDC setup clearer and more resilient, especially for in-cluster deployments.
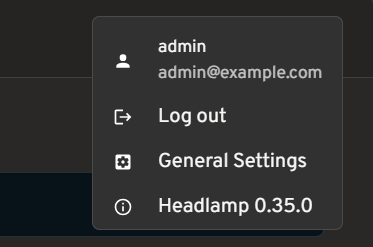 View of user information for OIDC clusters
Changes:
- User information displayed in the top bar for OIDC-authenticated users
- PKCE support for more secure authentication flows, as well as hardened token refresh handling
- Documentation for using the access token using
-oidc-use-access-token=true - Improved support for public OIDC clients like AKS and EKS
- New guide for setting up Headlamp on AKS with Azure Entra-ID using OAuth2Proxy
Thanks to David Dobmeier and Harsh Srivastava.
App Catalog and Helm
We've broadened how you deploy and source apps via Headlamp, specifically supporting vanilla Helm repos.
Changes:
- A more capable Helm chart with optional backend TLS termination, PodDisruptionBudgets, custom pod labels, and more
- Improved formatting and added missing access token arg in the Helm chart
- New in-cluster Helm support with an
--enable-helmflag and a service proxy
Thanks to Vrushali Shah and Murali Annamneni from Oracle, and also to Pat Riehecky, Joshua Akers, Rostislav Stříbrný, Rick L,and Victor.
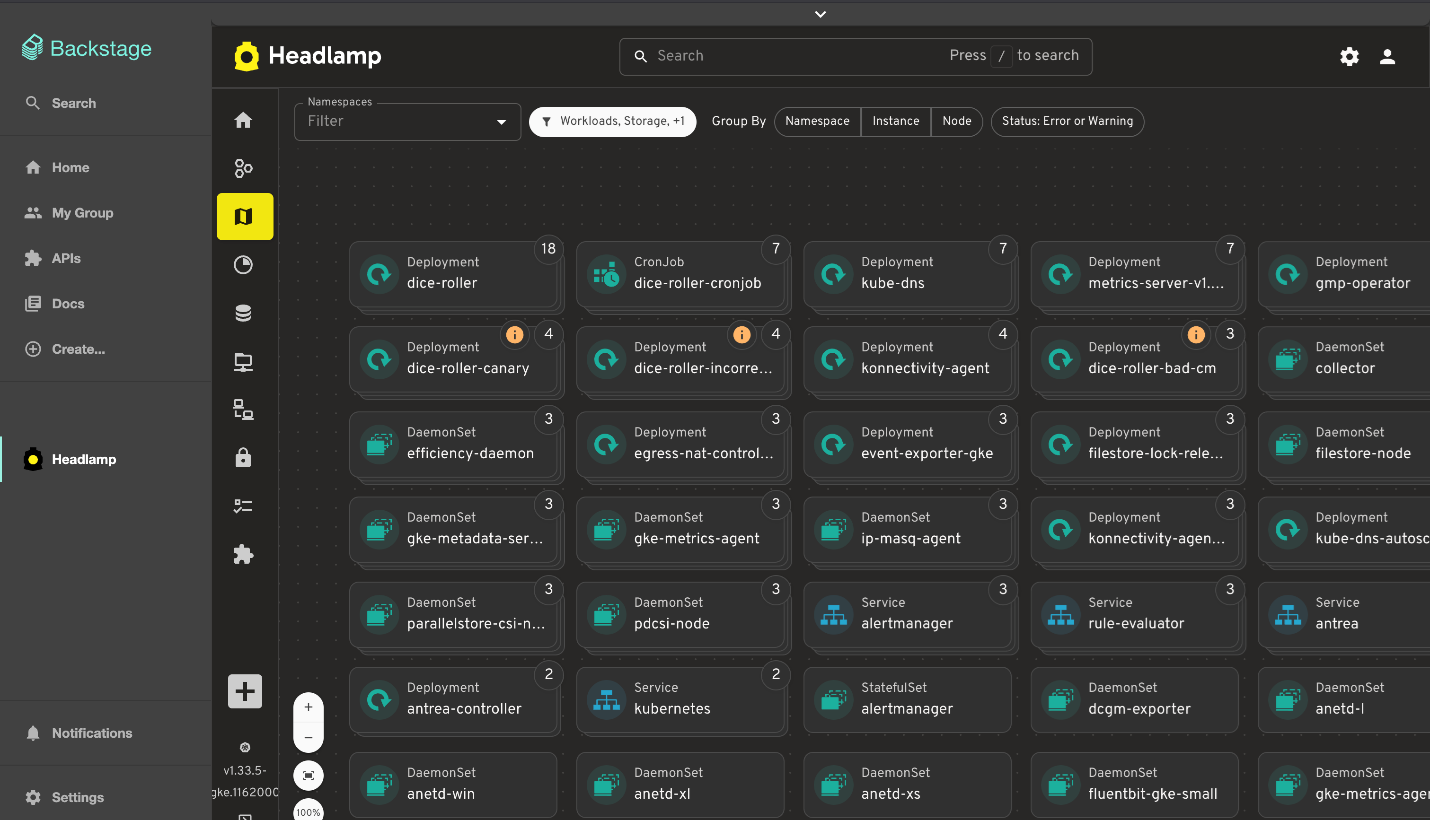
Performance, accessibility, and UX
Finally, we've spent a lot of time on the things you notice every day but don't always make headlines: startup time, list views, log viewers, accessibility, and small network UX details. A continuous accessibility self-audit has also helped us identify key issues and make Headlamp easier for everyone to use.
 View of the Learn section in docs
Changes:
- Significant desktop improvements, with up to 60% faster app loads and much quicker dev-mode reloads for contributors
- Numerous table and log viewer refinements: persistent sort order, consistent row actions, copy-name buttons, better tooltips, and more forgiving log inputs
- Accessibility and localization improvements, including fixes for zoom-related layout issues, better color contrast, improved screen reader support, and expanded language coverage
- More control over resources, with live pod CPU/memory metrics, richer pod details, and inline editing for secrets and CRD fields
- A refreshed documentation and plugin onboarding experience, including a "Learn" section and plugin showcase
- A more complete NetworkPolicy UI and network-related polish
- Nightly builds available for early testing
Thanks to Jaehan Byun and Jan Jansen.
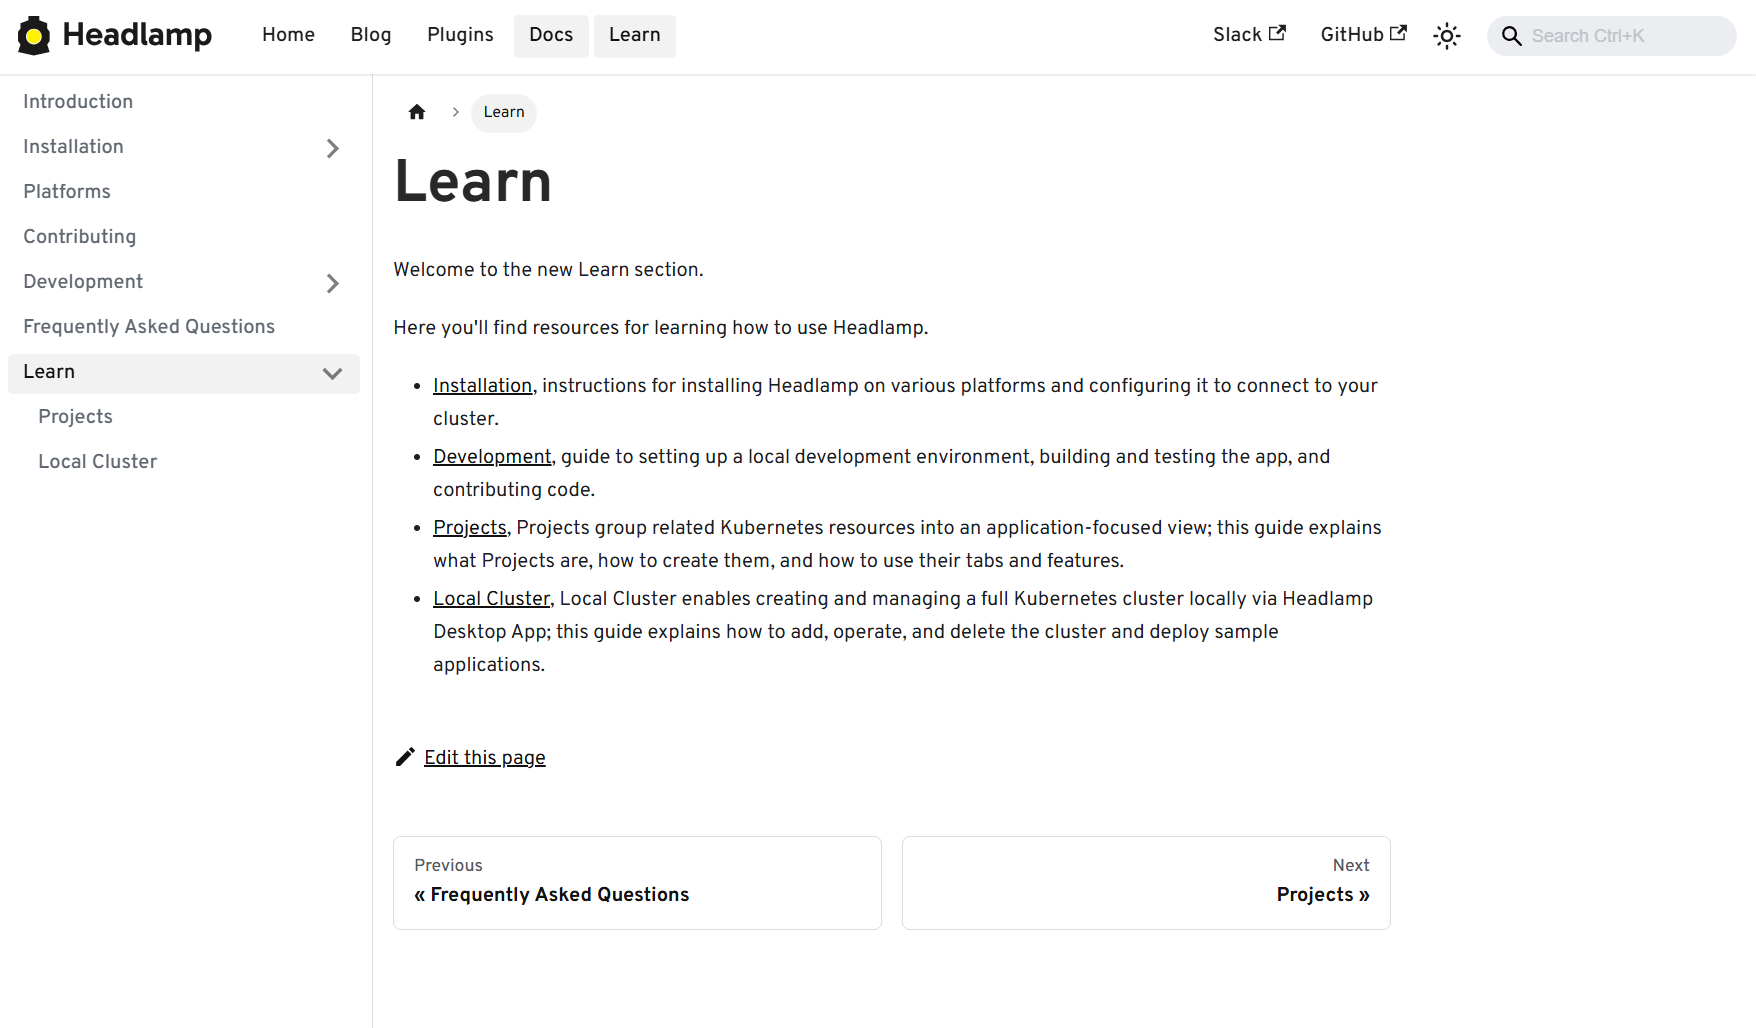
Plugins and extensibility
Discovering plugins is simpler now - no more hopping between Artifact Hub and assorted GitHub repos. Browse our dedicated Plugins page for a curated catalog of Headlamp-endorsed plugins, along with a showcase of featured plugins.
 View of the Plugins showcase
Headlamp AI Assistant
Managing Kubernetes often means memorizing commands and juggling tools. Headlamp's new AI Assistant changes this by adding a natural-language interface built into the UI. Now, instead of typing kubectl or digging through YAML you can ask, "Is my app healthy?" or "Show logs for this deployment," and get answers in context, speeding up troubleshooting and smoothing onboarding for new users. Learn more about it here.
New plugins additions
Alongside the new AI Assistant, we've been growing Headlamp's plugin ecosystem so you can bring more of your workflows into a single UI, with integrations like Minikube, Karpenter, and more.
Highlights from the latest plugin releases:
- Minikube plugin, providing a locally stored single node Minikube cluster
- Karpenter plugin, with support for Azure Node Auto-Provisioning (NAP)
- KEDA plugin, which you can learn more about here
- Community-maintained plugins for Gatekeeper and KAITO
Thanks to Vrushali Shah and Murali Annamneni from Oracle, and also to Anirban Singha, Adwait Godbole, Sertaç Özercan, Ernest Wong, and Chloe Lim.
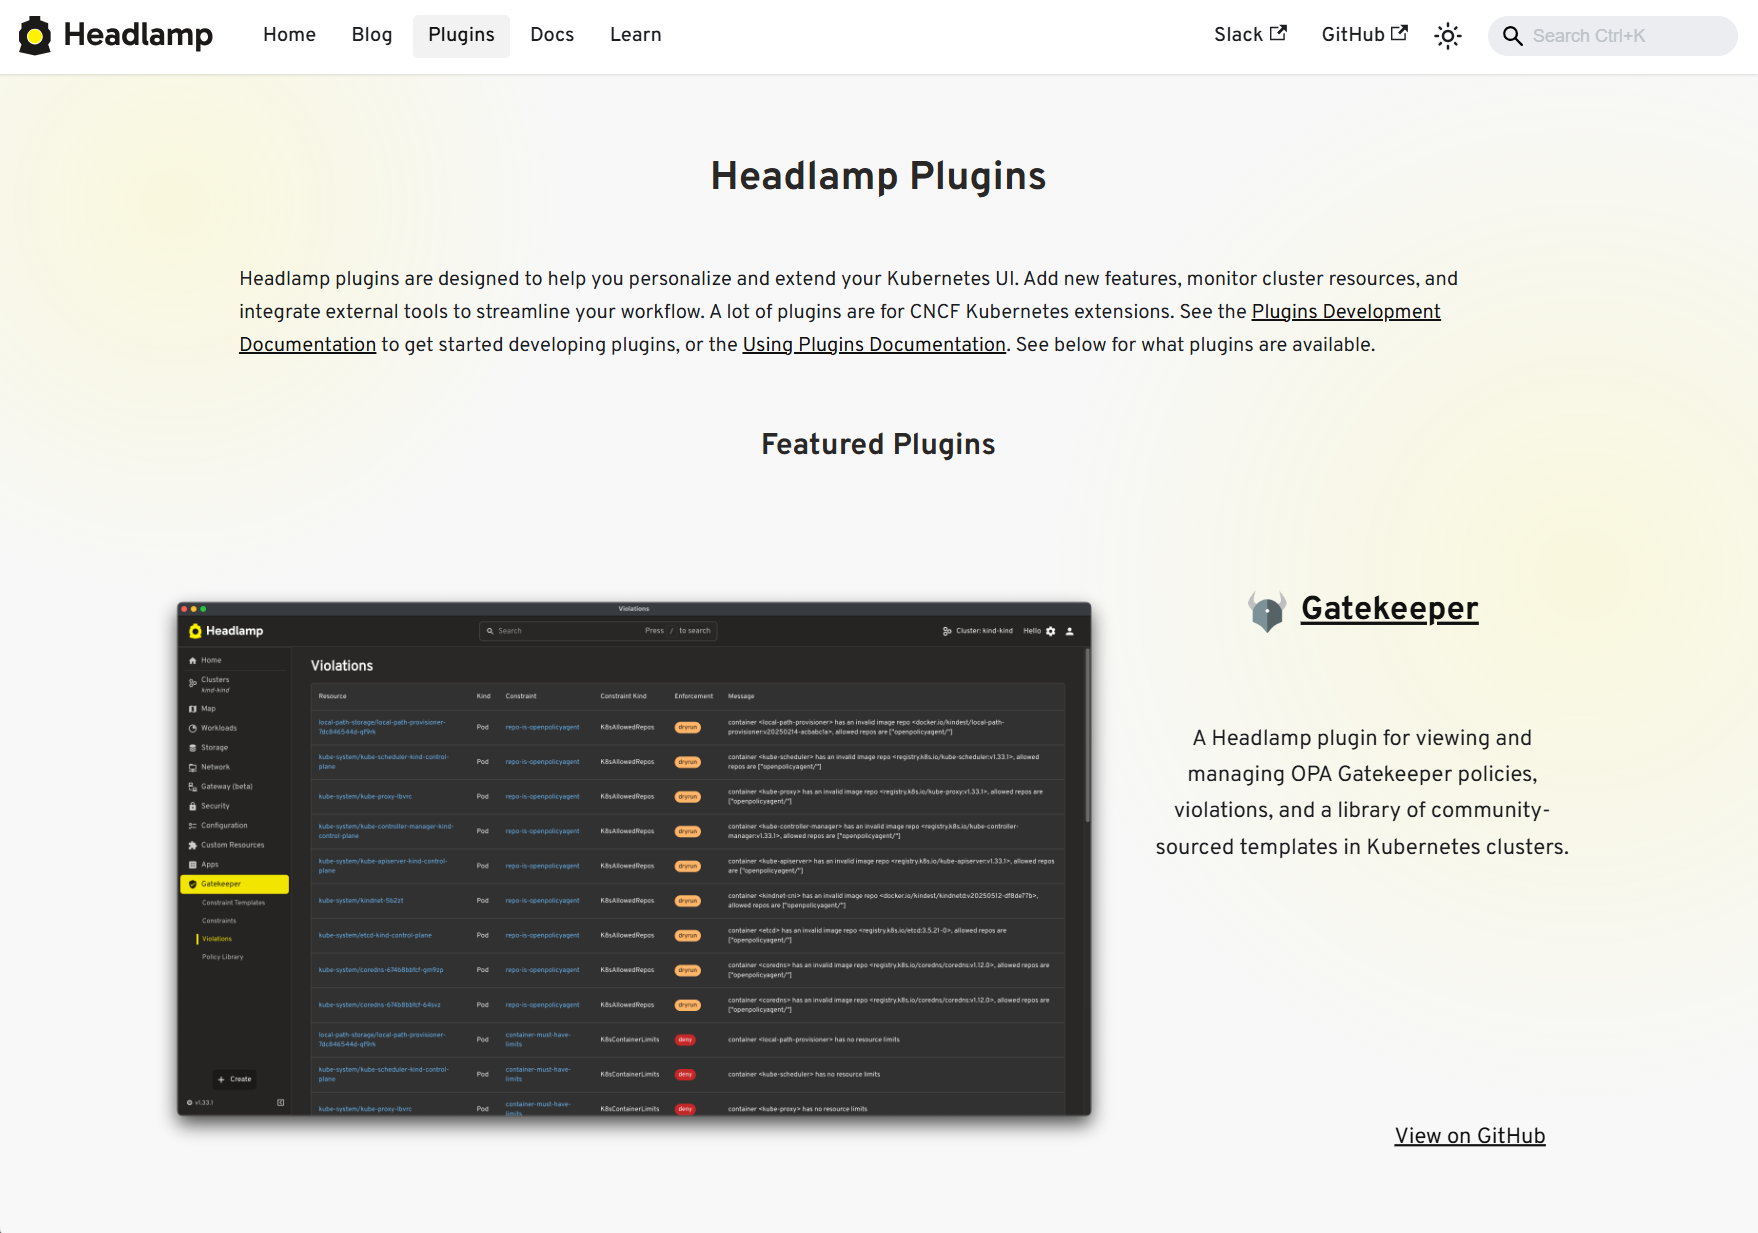
Other plugins updates
Alongside new additions, we've also spent time refining plugins that many of you already use, focusing on smoother workflows and better integration with the core UI.
 View of the Backstage plugin
Changes:
- Flux plugin: Updated for Flux v2.7, with support for newer CRDs, navigation fixes so it works smoothly on recent clusters
- App Catalog: Now supports Helm repos in addition to Artifact Hub, can run in-cluster via /serviceproxy, and shows both current and latest app versions
- Plugin Catalog: Improved card layout and accessibility, plus dependency and Storybook test updates
- Backstage plugin: Dependency and build updates, more info here
Plugin development
We've focused on making it faster and clearer to build, test, and ship Headlamp plugins, backed by improved documentation and lighter tooling.
 View of the Plugin Development guide
Changes:
- New and expanded guides for plugin architecture and development, including how to publish and ship plugins
- Added i18n support documentation so plugins can be translated and localized
- Added example plugins: ui-panels, resource-charts, custom-theme, and projects
- Improved type checking for Headlamp APIs, restored Storybook support for component testing, and reduced dependencies for faster installs and fewer updates
- Documented plugin install locations, UI signifiers in Plugin Settings, and labels that differentiated shipped, UI-installed, and dev-mode plugins
Security upgrades
We've also been investing in keeping Headlamp secure - both by tightening how authentication works and by staying on top of upstream vulnerabilities and tooling.
Updates:
- We've been keeping up with security updates, regularly updating dependencies and addressing upstream security issues.
- We tightened the Helm chart's default security context and fixed a regression that broke the plugin manager.
- We've improved OIDC security with PKCE support, helping unblock more secure and standards-compliant OIDC setups when deploying Headlamp in-cluster.
Conclusion
Thank you to everyone who has contributed to Headlamp this year - whether through pull requests, plugins, or simply sharing how you're using the project. Seeing the different ways teams are adopting and extending the project is a big part of what keeps us moving forward. If your organization uses Headlamp, consider adding it to our adopters list.
If you haven't tried Headlamp recently, all these updates are available today. Check out the latest Headlamp release, explore the new views, plugins, and docs, and share your feedback with us on Slack or GitHub - your feedback helps shape where Headlamp goes next.
22 Jan 2026 2:00am GMT
21 Jan 2026
Kubernetes Blog
Announcing the Checkpoint/Restore Working Group
The community around Kubernetes includes a number of Special Interest Groups (SIGs) and Working Groups (WGs) facilitating discussions on important topics between interested contributors. Today we would like to announce the new Kubernetes Checkpoint Restore WG focusing on the integration of Checkpoint/Restore functionality into Kubernetes.
Motivation and use cases
There are several high-level scenarios discussed in the working group:
- Optimizing resource utilization for interactive workloads, such as Jupyter notebooks and AI chatbots
- Accelerating startup of applications with long initialization times, including Java applications and LLM inference services
- Using periodic checkpointing to enable fault-tolerance for long-running workloads, such as distributed model training
- Providing interruption-aware scheduling with transparent checkpoint/restore, allowing lower-priority Pods to be preempted while preserving the runtime state of applications
- Facilitating Pod migration across nodes for load balancing and maintenance, without disrupting workloads.
- Enabling forensic checkpointing to investigate and analyze security incidents such as cyberattacks, data breaches, and unauthorized access.
Across these scenarios, the goal is to help facilitate discussions of ideas between the Kubernetes community and the growing Checkpoint/Restore in Userspace (CRIU) ecosystem. The CRIU community includes several projects that support these use cases, including:
- CRIU - A tool for checkpointing and restoring running applications and containers
- checkpointctl - A tool for in-depth analysis of container checkpoints
- criu-coordinator - A tool for coordinated checkpoint/restore of distributed applications with CRIU
- checkpoint-restore-operator - A Kubernetes operator for managing checkpoints
More information about the checkpoint/restore integration with Kubernetes is also available here.
Related events
Following our presentation about transparent checkpointing at KubeCon EU 2025, we are excited to welcome you to our panel discussion and AI + ML session at KubeCon + CloudNativeCon Europe 2026.
Connect with us
If you are interested in contributing to Kubernetes or CRIU, there are several ways to participate:
- Join our meeting every second Thursday at 17:00 UTC via the Zoom link in our meeting notes; recordings of our prior meetings are available here.
- Chat with us on the Kubernetes Slack: #wg-checkpoint-restore
- Email us at the wg-checkpoint-restore mailing list
21 Jan 2026 6:00pm GMT
19 Jan 2026
Kubernetes Blog
Uniform API server access using clientcmd
If you've ever wanted to develop a command line client for a Kubernetes API, especially if you've considered making your client usable as a kubectl plugin, you might have wondered how to make your client feel familiar to users of kubectl. A quick glance at the output of kubectl options might put a damper on that: "Am I really supposed to implement all those options?"
Fear not, others have done a lot of the work involved for you. In fact, the Kubernetes project provides two libraries to help you handle kubectl-style command line arguments in Go programs: clientcmd and cli-runtime (which uses clientcmd). This article will show how to use the former.
General philosophy
As might be expected since it's part of client-go, clientcmd's ultimate purpose is to provide an instance of restclient.Config that can issue requests to an API server.
It follows kubectl semantics:
- defaults are taken from
~/.kubeor equivalent; - files can be specified using the
KUBECONFIGenvironment variable; - all of the above settings can be further overridden using command line arguments.
It doesn't set up a --kubeconfig command line argument, which you might want to do to align with kubectl; you'll see how to do this in the "Bind the flags" section.
Available features
clientcmd allows programs to handle
kubeconfigselection (usingKUBECONFIG);- context selection;
- namespace selection;
- client certificates and private keys;
- user impersonation;
- HTTP Basic authentication support (username/password).
Configuration merging
In various scenarios, clientcmd supports merging configuration settings: KUBECONFIG can specify multiple files whose contents are combined. This can be confusing, because settings are merged in different directions depending on how they are implemented. If a setting is defined in a map, the first definition wins, subsequent definitions are ignored. If a setting is not defined in a map, the last definition wins.
When settings are retrieved using KUBECONFIG, missing files result in warnings only. If the user explicitly specifies a path (in --kubeconfig style), there must be a corresponding file.
If KUBECONFIG isn't defined, the default configuration file, ~/.kube/config, is used instead, if present.
Overall process
The general usage pattern is succinctly expressed in the clientcmd package documentation:
loadingRules := clientcmd.NewDefaultClientConfigLoadingRules()
// if you want to change the loading rules (which files in which order), you can do so here

configOverrides := &clientcmd.ConfigOverrides{}
// if you want to change override values or bind them to flags, there are methods to help you

kubeConfig := clientcmd.NewNonInteractiveDeferredLoadingClientConfig(loadingRules, configOverrides)
config, err := kubeConfig.ClientConfig()
if err != nil {
 // Do something
}
client, err := metav1.New(config)
// ...
In the context of this article, there are six steps:
- Configure the loading rules.
- Configure the overrides.
- Build a set of flags.
- Bind the flags.
- Build the merged configuration.
- Obtain an API client.
Configure the loading rules
clientcmd.NewDefaultClientConfigLoadingRules() builds loading rules which will use either the contents of the KUBECONFIG environment variable, or the default configuration file name (~/.kube/config). In addition, if the default configuration file is used, it is able to migrate settings from the (very) old default configuration file (~/.kube/.kubeconfig).
You can build your own ClientConfigLoadingRules, but in most cases the defaults are fine.
Configure the overrides
clientcmd.ConfigOverrides is a struct storing overrides which will be applied over the settings loaded from the configuration derived using the loading rules. In the context of this article, its primary purpose is to store values obtained from command line arguments. These are handled using the pflag library, which is a drop-in replacement for Go's flag package, adding support for double-hyphen arguments with long names.
In most cases there's nothing to set in the overrides; I will only bind them to flags.
Build a set of flags
In this context, a flag is a representation of a command line argument, specifying its long name (such as --namespace), its short name if any (such as -n), its default value, and a description shown in the usage information. Flags are stored in instances of the FlagInfo struct.
Three sets of flags are available, representing the following command line arguments:
- authentication arguments (certificates, tokens, impersonations, username/password);
- cluster arguments (API server, certificate authority, TLS configuration, proxy, compression)
- context arguments (cluster name,
kubeconfiguser name, namespace)
The recommended selection includes all three with a named context selection argument and a timeout argument.
These are all available using the Recommended…Flags functions. The functions take a prefix, which is prepended to all the argument long names.
So calling clientcmd.RecommendedConfigOverrideFlags("") results in command line arguments such as --context, --namespace, and so on. The --timeout argument is given a default value of 0, and the --namespace argument has a corresponding short variant, -n. Adding a prefix, such as "from-", results in command line arguments such as --from-context, --from-namespace, etc. This might not seem particularly useful on commands involving a single API server, but they come in handy when multiple API servers are involved, such as in multi-cluster scenarios.
There's a potential gotcha here: prefixes don't modify the short name, so --namespace needs some care if multiple prefixes are used: only one of the prefixes can be associated with the -n short name. You'll have to clear the short names associated with the other prefixes' --namespace , or perhaps all prefixes if there's no sensible -n association. Short names can be cleared as follows:
kflags := clientcmd.RecommendedConfigOverrideFlags(prefix)
kflags.ContextOverrideFlags.Namespace.ShortName = ""
In a similar fashion, flags can be disabled entirely by clearing their long name:
kflags.ContextOverrideFlags.Namespace.LongName = ""
Bind the flags
Once a set of flags has been defined, it can be used to bind command line arguments to overrides using clientcmd.BindOverrideFlags. This requires a pflag FlagSet rather than one from Go's flag package.
If you also want to bind --kubeconfig, you should do so now, by binding ExplicitPath in the loading rules:
flags.StringVarP(&loadingRules.ExplicitPath, "kubeconfig", "", "", "absolute path(s) to the kubeconfig file(s)")
Build the merged configuration
Two functions are available to build a merged configuration:
clientcmd.NewInteractiveDeferredLoadingClientConfigclientcmd.NewNonInteractiveDeferredLoadingClientConfig
As the names suggest, the difference between the two is that the first can ask for authentication information interactively, using a provided reader, whereas the second only operates on the information given to it by the caller.
The "deferred" mention in these function names refers to the fact that the final configuration will be determined as late as possible. This means that these functions can be called before the command line arguments are parsed, and the resulting configuration will use whatever values have been parsed by the time it's actually constructed.
Obtain an API client
The merged configuration is returned as a ClientConfig instance. An API client can be obtained from that by calling the ClientConfig() method.
If no configuration is given (KUBECONFIG is empty or points to non-existent files, ~/.kube/config doesn't exist, and no configuration is given using command line arguments), the default setup will return an obscure error referring to KUBERNETES_MASTER. This is legacy behaviour; several attempts have been made to get rid of it, but it is preserved for the --local and --dry-run command line arguments in --kubectl. You should check for "empty configuration" errors by calling clientcmd.IsEmptyConfig() and provide a more explicit error message.
The Namespace() method is also useful: it returns the namespace that should be used. It also indicates whether the namespace was overridden by the user (using --namespace).
Full example
Here's a complete example.
package main

import (
 "context"
 "fmt"
 "os"

 "github.com/spf13/pflag"
 v1 "k8s.io/apimachinery/pkg/apis/meta/v1"
 "k8s.io/client-go/kubernetes"
 "k8s.io/client-go/tools/clientcmd"
)

func main() {
 // Loading rules, no configuration
 loadingRules := clientcmd.NewDefaultClientConfigLoadingRules()

 // Overrides and flag (command line argument) setup
 configOverrides := &clientcmd.ConfigOverrides{}
 flags := pflag.NewFlagSet("clientcmddemo", pflag.ExitOnError)
 clientcmd.BindOverrideFlags(configOverrides, flags,
 clientcmd.RecommendedConfigOverrideFlags(""))
 flags.StringVarP(&loadingRules.ExplicitPath, "kubeconfig", "", "", "absolute path(s) to the kubeconfig file(s)")
 flags.Parse(os.Args)

 // Client construction
 kubeConfig := clientcmd.NewNonInteractiveDeferredLoadingClientConfig(loadingRules, configOverrides)
 config, err := kubeConfig.ClientConfig()
 if err != nil {
 if clientcmd.IsEmptyConfig(err) {
 panic("Please provide a configuration pointing to the Kubernetes API server")
 }
 panic(err)
 }
 client, err := kubernetes.NewForConfig(config)
 if err != nil {
 panic(err)
 }

 // How to find out what namespace to use
 namespace, overridden, err := kubeConfig.Namespace()
 if err != nil {
 panic(err)
 }
 fmt.Printf("Chosen namespace: %s; overridden: %t\n", namespace, overridden)

 // Let's use the client
 nodeList, err := client.CoreV1().Nodes().List(context.TODO(), v1.ListOptions{})
 if err != nil {
 panic(err)
 }
 for _, node := range nodeList.Items {
 fmt.Println(node.Name)
 }
}
Happy coding, and thank you for your interest in implementing tools with familiar usage patterns!
19 Jan 2026 6:00pm GMT