26 Oct 2026
 Planet Python
Stein Magnus Jodal: Introduction to barcode parsing
Barcodes are everywhere.
They're so omnipresent that we easily take them for granted, and rarely think about their existence and how they really work. Meanwhile, barcodes are extremely important for all kinds of logistics, the foundation of modern society.
This post is an introduction to barcode parsing, and to all the corner cases that make it a bad idea to write your own barcode parser.
26 Oct 2026 12:00am GMT
Python Insider: Python 3.15.2, 3.14.10, 3.13.18, 3.12.16 and 3.11.18 are out
Five expedited security releases to distrust the compromised eMudhra intermediate CA keys.
26 Oct 2026 12:00am GMT
25 Oct 2026
Planet Python
The No Title® Tech Blog: Just updated - Optimize Images v2.2.0
Optimize Images 2.2.0 has just been released, and it makes JPEG files even smaller by default, adds an optional SSIM-based quality check, and now keeps embedded colour profiles such as the Display P3 profile of iPhone photos. It also requires Pillow 13.0.0 for important security fixes, and makes batches and watch mode more reliable.
25 Oct 2026 9:40pm GMT
23 Oct 2026
Django community aggregator: Community blog posts
Issue 360: Python and Wagtail Security Releases
News
Python 3.15.1, 3.14.9 and 3.13.17 are now available
Expedited security releases on October 21, carrying pip 26.2.2 and certifi 2026.10.19 to drop the compromised eMudhra CA. 3.13 is the odd one out: it had just entered security-only mode, where pip is not normally updated, so the team cut fresh installers anyway. 3.15.1 is also 3.15's first maintenance release, with roughly 330 fixes from 117 contributors.
Information for Python users regarding the eMudhra / emSign CA certificate security incident
The emSign root was pulled from CA bundles after eMudhra's intermediate keys turned out to be insecure, leaving older clients open to man-in-the-middle attacks against PyPI and python.org. Upgrade now: certifi 2026.10.19, pip 26.2.2, uv 0.13.4, sigstore 4.5.1, in every virtualenv and container image. pip is the one that matters most, since it always trusts its vendored bundle and distrusting the CA at the OS level will not help.
Eight Bits of Trust: eMudhra's CA Keys Cracked in Milliseconds
The technical story behind the advisory, and it is remarkable: each P-384 private key was 47 zero bytes followed by one non-zero byte, so Scott Helme recovered all eight in under a second on a laptop by trying 255 candidates. eMudhra blames a key ceremony script that generated a second weak keypair, picked up for the CSR because the names looked alike.
Wagtail CMS News
Wagtail 8.0.1, 7.4.4, and 7.0.10 security releases
All three landed on October 20 with the same four fixes: an authorization bypass across collections via privacy settings, formula injection in XLSX exports, mishandled ancestor restrictions in the Pages admin API, and stored XSS through third-party HTML editors. 8.0.1 adds a fifth, access restrictions on the API v3 pages endpoint, plus a batch of API v3 write fixes. Also out: 7.4.4 and 7.0.10.
Wagtail 8.1 RC1
The release candidate adds Python 3.15 support and drops 3.10. API v3 gains write support for TypedTableBlock and nested inline relations, an ImageRenditionField, and workflow operations for pages and snippets. Redirects are now auto-created only when a live page moves or is renamed; set WAGTAILREDIRECTS_AUTO_CREATE = 'always' to get the old behavior back.
Django Software Foundation
Quarterly contributor outreach
Tim Schilling posts the Steering Council's list of what needs hands for 6.2: testing CompositeField, plus review on a DEFAULT_PK_FIELD setting, moving models between apps, partitioned cookies, and HTTP QUERY support. A second list covers ideas needing technical vetting, including a task timeout API and import maps.
Django Steering Council Meeting, October 19
This week's agenda: the quarterly outreach message, the Sovereign Tech Agency Resilience Fund, the VectorField DEP, Memcached clients, Jazzband updates, and suggestions for the new Triage and Review Team.
Updates to Django
Last week we had 15 pull requests merged into Django by 10 different contributors - including 3 first-time contributors! Congratulations to Sanskar Kharya, Aman Kumar Jain and Helmi Lakhder for having their first commits merged into Django - welcome on board!
New in Django 6.2:
- Streaming responses now include configured CSP nonces in their headers, even when unused in the body. Inline scripts or styles that previously passed without a matching nonce may now be blocked or reported.
- A CSP directive whose only source is NONCE is emitted as
'none'when the nonce goes unused, instead of being dropped from the header. - Directories created during file uploads and by the file-based cache backend now combine the requested permissions mode with the process umask, matching
os.mkdir. A typical0o022umask turns0o775into0o755, and the set-group-ID bit is no longer guaranteed, so set it on the parent directory instead.FILE_UPLOAD_PERMISSIONSis unaffected. - The warning logged when a database error occurs while validating model constraints now escapes the message and trims it to 4096 characters.
- Python 3.15 compatibility is now documented.
New in Django 6.1:
- Fixed a crash in
makemessageson Windows with non-ASCII filenames on Python 3.15+, or with UTF-8 mode enabled on older versions (#37447). - The undocumented
get_success_url_allowed_hosts()andget_redirect_url()methods fromRedirectURLMixinnow accept an optionalrequestargument.
Sponsored
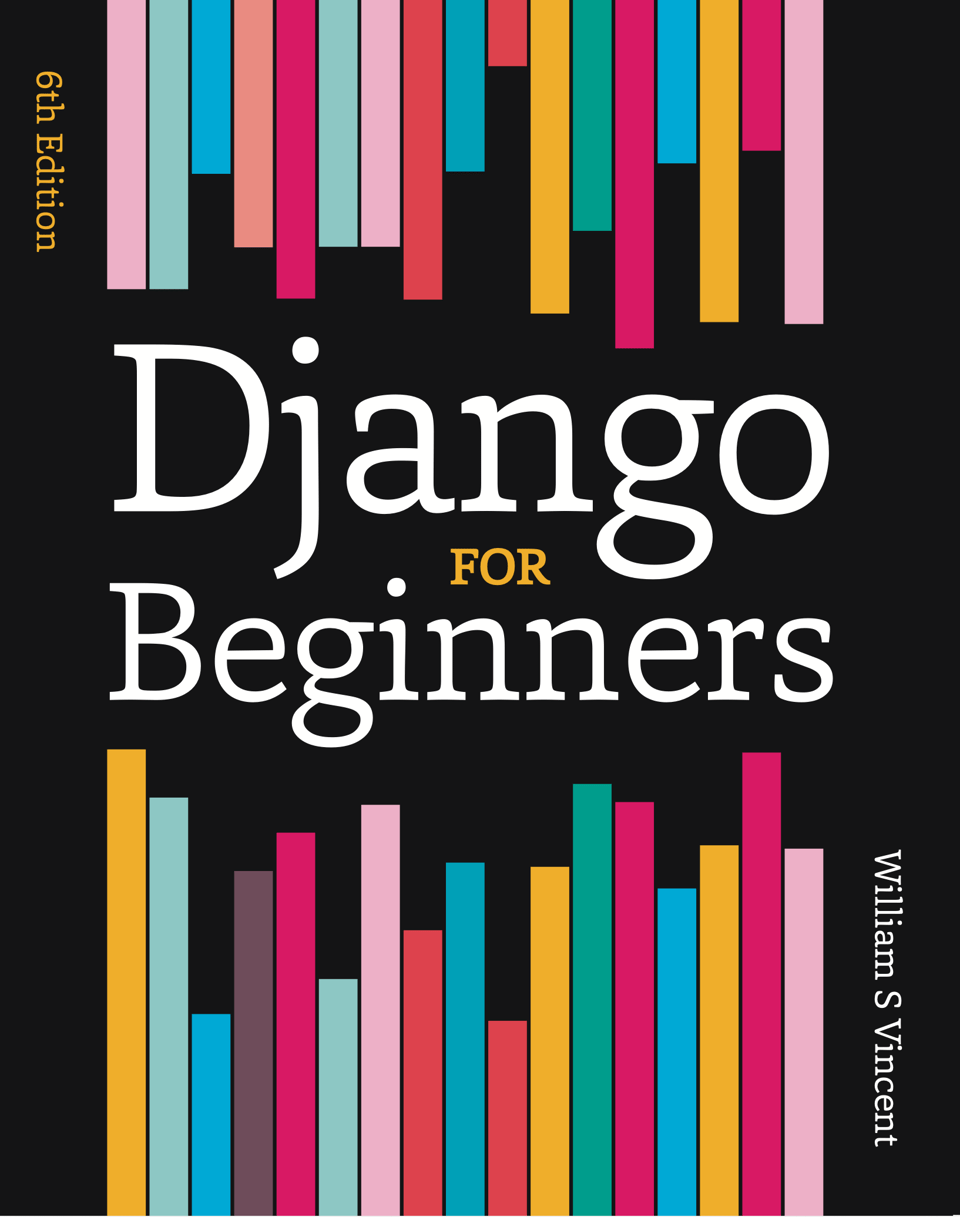
Django for Beginners, 6th Edition
The sixth edition was published this week, available in digital and paperback formats. It features two new chapters, completely updated for Django 6.1+, and more. Read the first four chapters for free to try it out.
Django Fellow Reports
Django Fellow Report - Jacob
Chasing a forum thread led Jacob Tyler Walls to merge a fix that reduces the cost of building many-to-many related managers. He also spotted the last tweaks needed for multiline template tags, drafted a security fix, and triaged a JSONField RecursionError on deeply nested input.
Django Fellow Report - Natalia
Natalia Bidart kept the djangodocs Sphinx cleanup and the DEP 20 release checklists moving, including CVE records that can name the first affected release per branch. The Triage and Review Team held its first meeting, and the Security and Triage teams both gained members.
Django Fellow Report - Sarah
A short week around coughs and colds, but Sarah Boyce landed CSP nonces in headers for streaming responses, corrected verbatim-block tokenization, and enforced integer expiry times for file-based sessions. She also added Lilian Tran to the security team and Shai Berger as a triager.
Python Software Foundation
Announcing Python Software Foundation Fellow Members for Q3 2026
Aldo Caneo, Donghee Na, Paul Moore, and Takayuki Shimizukawa join the Fellow roster, recognized together for maintaining libraries, writing educational material, organizing events, and mentoring. Q4 nominations close November 20, 2026; email psf-fellow at python.org with the nominee's accomplishments.
Checking email reputation, and allowing Outlook again
PyPI blocked outlook.com and hotmail.com outright in June 2024 after a bulk malware campaign, which caught legitimate users too. A donated reputation service from UserCheck now judges addresses individually, so both domains are allowed again; in its first month it rejected 62 disposable domains and 120+ throwaway addresses.
Wikis: Relaunched!
The Python, PSF, and Jython wikis went read-only in February after AI scrapers overwhelmed hosts partly still running Python 2. They are back as static sites on GitHub Pages, edited by pull request against psf/wiki, with write access going first to the old wikis' known stewards.
Articles
Django's Brightest Timeline
Tim Schilling argues Django's feature process has quietly come together: new-feature ideas live in a GitHub repo where emoji reactions act as votes, proposals get asked to prove themselves as third-party packages first, and Django Probe plus Praful Gulani's experimental-features GSoC work could decide what lands on usage data instead of advocacy.
Django: check version support with norwegianblue
Hugo van Kemenade's eol command pulls endoflife.date into a color-coded table, so eol django shows release, support, and end-of-life dates at a glance (6.1, 6.0, and 5.2 supported, 6.0 security-only). uv tool install norwegianblue, and it speaks Markdown, reStructuredText, and JSON for docs and scripts.
Your workers open a new Postgres connection for every task
Django's default CONN_MAX_AGE = 0 means every task a worker picks up opens its own Postgres connection, about 5ms, longer than claiming and running the task on a warm one. Set it to 600 or use a connection pool before you benchmark anything. The numbers come from django-ox's own vendor.
Automating Django deployments with Deployer
Stein Ove Helset replaces his SSH-and-run-the-commands routine with Deployer, a PHP tool that is happy to run manage.py: dep deploy builds a fresh release with its own virtualenv, runs checks, migrations, and collectstatic, then flips a current symlink and restarts Gunicorn. Shared .env and media survive between releases, and rolling back is one command.
How I decide which Python and Django versions I want to support
Matthias Kestenholz splits the question by context: projects track the current stable release or a pre-release, while the more foundational a library is, the further back it should reach. He drops versions to prune CI cost or to use something new, and lands on Python 3.10+ with Django 3.2 or 4.2+ for most packages.
Events
IndyPy: Django & FastAPI: What's Next?
Tuesday, November 24 at 7pm ET, hybrid from E-gineering in Indianapolis or over Zoom. Tim Schilling covers what's new in contributing to Django, and Calvin Hendryx-Parker argues batteries-included against speed in the Django/FastAPI debate. Register on Meetup for the in-person seat or the Zoom link.
Podcasts
Django Chat #208: Django in Space with Loes Crama
Loes Crama is a software engineer at cosine Measurement Systems, contributing to ESA's NewAthena mission. We discuss her lifelong interest in space and how her work combines software engineering, data engineering, and data science.
Videos
Django in Space with Loes Crama
Loes Crama is a software engineer at cosine Measurement Systems working on ESA's NewAthena mission, the subject of her DjangoCon Europe talk on how Django helps build the largest X-ray observatory yet. This Django Chat episode covers how she arrived at a job that combines software engineering, data engineering, and data science.

Sponsored
Reach 4,300+ Engaged Django Developers
Sponsor this newsletter to reach an active community of Python and Django developers.
Django Job Board
The PSF is hiring its next CPython Developer in Residence, alongside two senior Python roles, one AI-leaning in the US and one in Barcelona with relocation support.
CPython Developer in Residence at Python Software Foundation 🆕
Senior Software Engineer - Python, React & AI at Camden Kelly Staffing 🆕
Senior Python Engineer (Barcelona-based / Relocation support to Barcelona) at Manychat 🆕
Projects
django-ses/django-ses
A Django email backend for Amazon's Simple Email Service.
ivelum/djangoql
Advanced search language for Django admin.
Sponsor Django News
Reach 4,300+ Django developers every Friday. See sponsorship details and rates.
23 Oct 2026 3:00pm GMT
21 Oct 2026
Django community aggregator: Community blog posts
How I decide which Python and Django versions I want to support
How I decide which Python and Django versions I want to support
A recent post on Mastodon got me thinking about what my philosophy for dropping support for old versions of Python and Django is. Here's the post:
🚨 Important Announcement 🚨
Going forward all my packages will only "officially" support maintained #Python versions. Meaning since October only 3.14 and now 3.15.
This has no effect on Django version support.
CVEs will be backported to older 🐍 releases.
I tend to support versions long past their End of Life date. I jokingly said that I should spend time upgrading old websites instead of spending time writing a rationale why not. I don't want to argue for my position, but maybe this post will serve as the place to point people towards when the question arises again in the future.
The short answer: it depends on whether I'm working on a project, on my own machine or on a library.
Projects
When working on projects I'm always updating to the current stable version or even the bleeding edge. I want the projects to be as future-proof as possible and I also want to give early feedback when stuff breaks.
As long as the server software allows it, I'm just going to use uv to install the newest Python version that all the packages I'm using support (or at least ship binary wheels for), because I enjoy not compiling software when deploying too damn much.
Developer workstations
When it comes to developer workstations I don't really have the patience for outdated software. I don't see a reason why developer tooling can't be up to date. This came up recently in the django-debug-toolbar issue tracker. I'm totally fine with requiring an up-to-date version of Python for our pre-commit hooks, for example.
Libraries
The more foundational and widely used a library (potentially) is, the more important it is to me that it supports basically everything which is reasonable.
I'm still using my libraries in older projects myself, so they have to work there. I want to use them in all environments, at least when I'm not paying a big price in terms of language features.
Other people may be stuck on older versions too. People can upgrade their software, but there may be situations (for example in managed hosting environments) where people cannot freely update the underlying managed server software. That isn't necessarily a problem security-wise as long as there are other measures in place protecting those services.
When people use my libraries, I might get additional eyes on the code, and possibly even contributions.
Supporting a large range of Django versions, for example 3.2 (reached EOL on 2024-04-01) up to the current main development branch, can be surprisingly easy when you do not reach too much into Django's internals or depend on features added only recently.
That said, when do I actually drop support for an old version of Python or Django? Generally speaking, I have two reasons:
🌳 Keeping CI time down 🌳
I like pruning the CI matrix so as to not spend too much compute and energy. The exceptions are packages such as django-debug-toolbar and django-tree-queries: they are widely used and have to work on a wide range of Python and Django versions and database engines, so the additional CI runs are worth it.
When I remove a version from the CI matrix I mostly raise the minimum version in the package metadata as well. I almost never use upper bounds for version ranges, but lower bounds I definitely do use.
Using new features, either because I want them or because I need them
Sometimes, I just really want to merge dictionaries using the nice a | b syntax. If this reasoning sounds whimsical to you, it is, but only partially. Programming cannot just be a job, everybody needs to have fun sometimes.
Sometimes, I really need some API or behavior Django has only introduced recently, such as the way bound fields work in forms. For example, form validation didn't go through bound fields before 4.0.
What that means right now
Most of my packages currently require Python 3.10 or newer and Django 3.2 or 4.2 or newer. Some of the less actively developed ones still go back as far as Python 3.8, simply because I haven't had a reason to touch them. Python and Django support are linked: Django 4.2 supports Python 3.8 to 3.12 while Django 6.0 requires Python 3.12, so the oldest Django version I support pretty much decides the oldest Python version worth testing.
What is the downside?
Supporting old versions makes it easier for people to put off upgrading. Some people just don't want to upgrade at all, and my libraries continuing to work on old versions certainly doesn't push them to do it. When they suddenly have to because all hell breaks loose (because of security problems or something like that) it's so much harder: they have a long way to go until they reach supported versions. That said, in my experience that's not a big problem with Django at all. On the other hand, when the projects still use npm packages from 2015… oh my.
The code is also less clean than it could be. Supporting old versions means compatibility shims, and it means not using some of the nicer features newer versions offer.
In the end, both approaches are reasonable, and both have their costs. You should do what brings you more joy.
21 Oct 2026 5:00pm GMT
Django in Space - Loes Crama
🔗 Links
- Loes on LinkedIn
- cosine
- Djangocon EU: How Django is helping to build the biggest X-ray observatory to date - Loes Crama
📦 Projects
📚 Books
- Weapons of Math Destruction by Cathy O'Neil
- Slouching Towards Utopia by J. Bradford DeLong
🎥 YouTube
21 Oct 2026 3:00pm GMT
09 Oct 2026
Planet Twisted
Glyph Lefkowitz: Programming Isn’t Special
Creative Work
Writers went on strike to get protections against "AI". Thousands of artists have signed open letters in protest of "AI". There are so many copyright lawsuits from creative industry groups against AI that there's a whole dedicated website for it. Popular YouTubers absolutely hate it. If they're also musicians, they REALLY hate it. Across all creative industries, there is a concerted push to reject this technology.
Yet, almost unique among creative fields, many experienced programmers remain convinced that it's fine to use "AI" for programming. We do seem to hate it, and what it's doing to our industry. It's making us all miserable, but we are using it anyway.
A lot of the justification of this resignation seems to be to be because programming is not Art. If the tool can get the job done, and the job is just functional, then why does it matter?
It does matter, though. It matters because we shouldn't be using AI to produce Art, and programming is Art.
Art can be Mundane
Some people will say that programs cannot be art because programs are functional, rather than being expressive. Programs are mundane whereas art is transcendent.
This is based on a distorted understanding of what Art actually is.
In John Berger's "Ways of Seeing", he names this type of distortion "mystification". His example of this process is both amusing and illustrative. I encourage you to read it in its entirety.
In summary, though: Berger critiques the florid prose of an art historian describing a commissioned group portrait, including phrases like "subtle modulations of the deep, glowing blacks" and "harmonious fusion". The portrait is described as sublime, in nearly ecstatic terms.
Berger reveals that the reality of this portrait is that a poor old painter needed some work, and some officials probably thought it might be nice to have an official portrait. So they paid some money to the poor old man, and he painted it, and then they had a painting. It's a well-executed portrait of a group of people. Beautiful, even. But it was work commissioned for a fairly mundane purpose and it suited that purpose just fine. It was not, and is not, a divine relic.
Culturally, we are prone to mystifying painting, and sculpture, and film, and music. We imbue them with "subtle modulations". We ignore their functional aspects - we desire decoration, amusement, and distraction - and focus on their emotional impact.
Don't get me wrong: I love me some good aesthetic philosophy. I think it's great to really examine our reactions to artwork and to try and gain a deeper understanding of our culture and our selves through media analysis. If anything we really need to do more of it.
This does not mean that the creation of such works is mystical or that it should be venerated beyond any other sort of labor.
Not least of which other types of labor that are adjacent to, but not as culturally venerated, as fine art. We tend to mystify the work of a novelist, but to denigrate the work of a journalist. In reality, the functional prose of the journalist is no less important and deserves no less respect.
Although they might be far below the ethereal realm that novelists inhabit in our collective imagination, even journalists receive more respect and thus more mystification than lowly copywriters. Yet, there is no transcendental distinction between "novelist" and "copywriter"; the many of the skills are the same, and the distinction is merely an accident of commerce and opportunity.
In fact, many famous writers have famously inhabited both roles. This is not an accident! Working with words professionally, even (perhaps especially) mundane words, is excellent practice for working with words in a more purely artistic context, because even mundane creativity is still artistic.
Code can be Beautiful
One thousand Internet years ago, when I was in my late teens, I would describe myself as a "code poet". I was relentlessly mocked for this as what the Youth would today call "being cringe", and at the time was referred to as "pretentious".
I succumbed to the peer pressure, removed it from my email signature and my bio. While I still believed strongly in the parallels, I accepted that - socially, at least - comparing code to poetry, or indeed to Art, was a silly thing to do.
However, I never abandoned the idea, in my heart.
The thing that I am most well-known for, the invention of Deferred, was specifically an aesthetic reaction to the tedium of passing callback and errback parameters to every single remote procedure call in an RPC client/server application. Those two callbacks got the job done just fine. But they were ugly, and annoying to work with.
Deferred is an intentional poem about asynchronous task execution, with a deliberate eye to the aesthetics of the problem and the experience of using it. It was influential because of its focus on aesthetics.
I do not want to overstate the beauty or profundity of this minor contribution, or indeed its durability. That a poem exists does not mean it is a great poem, merely that it is a poem.
Our aesthetic culture around programs is more like folk epic poetry than fine art, so the influence of this contribution is less about its specific enduring power than it is about its influence on what came next; from MochiKit.Async to JQuery Deferred to JavaScript Promises and eventually to async/await; a long chain of different artisans each adding something of their own until the original has all but dissolved. (And I wasn't the "original" here, either, as I drew heavily from the E language's Promises, among other things.)
In order to make code into a deliberate artistic expression, one must have spent quite a bit of time contemplating the problem domain. Without having experienced the tedium of manually passing a thousand callback parameters, I would have had neither the skill, nor indeed the motivation, to bother creating such a thing.
Now, most code does not have to be like this. Most code does not get to be like this. Most code is functional, workday code. Most code could not make a lady weep. It's just copy-writing, if you will.
As I explained previously, most writing couldn't do that either. Most writing is just copy-writing, too. Most visual art is advertising. Most live music performance is background music in bars that will go largely ignored.
However, code that is intentionally aesthetically designed tends to be important, both socially and technologically.
We do have some tradition of self-mystification in software. As Abelson memorably put it, "Programs must be written for people to read, and only incidentally for machines to execute.", so we have long had some conception of programs as highly expressive, even if we can't always agree on what they're expressing or to whom. We will occasionally wax poetical about the philosophical implications of a particular piece of software. This is not unique to a single piece of software, either; more than one community has indulged in similar philosophizing.
The expressive and aesthetic qualities of software are not limited to reading source code or interacting with other programmers via APIs, either. For example, every year, Federico Viticci does a review of Apple's new operating system, which is (among other things) an aesthetic critique. Such a project would not be possible if the software did not have an aesthetic impact on its users.
Not to mention that every video game review is also a software review.
A Brief Aside about Software Literacy
It does make me a bit sad that we don't have much of a critical reading tradition in the software community. Literate Programming is often praised, but rarely practiced.
Moreover, it makes me sad that users have a pretty jumbled idea of what goes into making software, that programming literacy is pretty low, and that modern programming practices often deliberately produce a bad mental model of what the software is doing so it's even harder for the user to understand. The aesthetic experience of software is often wildly detached from its internal state.
While all of these problems predate AI by years or indeed decades, that's no reason to enthusiastically make them worse.
Defend The Mundane
If we use AI to erase all the copy-writing, all the graphic design, all the boring mundane art, and yes, all the boring custom WordPress theme development, then we will be removing all the practical opportunities for the vast amounts of practice and contemplation required for people to elevate their craft to eventually achieve great things. Education is great, but the majority of true skill development happens on the job and always has.
This doesn't mean that we can't use abstractions, or automation, to make our work easier. Programming is the art of abstraction, of understanding how to compose smaller ideas into bigger ones, of how to understand the automation of a larger system by understanding the rules that automate smaller ones and understanding how to combine them.
When we use "AI" to eliminate that understanding rather than raise it up to a higher level, to entirely destroy that creative decision-making process, we do a disservice both to ourselves as programmers and to our users. We would be doing a disservice to our users and our downstream fellow developers in the same way that a visual artist would be doing a disservice to their viewers or a musician would be doing a disservice to their listeners if they served them auto-generated filler instead of their own creative output.
Slop is slop, no matter the medium.
Each mundane project has some tiny chance - let's say, something like 0.1% - of achieving greatness. If we do a single project with AI, then sure, whatever, there's almost no chance that that project was going to be the one hit to create that career-defining moment for an engineer working on it. If we make a habit of doing all projects that way, though, we take the total likelihood of those moments of greatness from "definitely sometimes" to "never".
The precisely appropriate ways in which to resist AI encroachment on all software development lie well beyond the margins of this one short post. How much you can resist and which specific uses you should resist are up to you. But it is worth resisting in software just as much as it would be worth resisting in any creative medium.
Programming isn't special. It's just Art, and Art is the most human - and thus, the most universal - thing that there is.
Acknowledgments
Thank you to my patrons who are supporting my writing on this blog. If you like what you've read here and you'd like to read more of it, or you'd like to support my various open-source endeavors, you can support my work as a sponsor!
09 Oct 2026 7:00am GMT
28 Sep 2026
Planet Twisted
Glyph Lefkowitz: What Would A Serious AI Product Look Like?
One of the issues that I have with the current generation of "AI" products is that they do not appear to take their own premises seriously. I look at a plethora of obsequious chatbots claiming to be serious tools for problem solving, and I think, this is not what a problem-solving tool would look like.
Even before we get to the tremendous ethical problems with the frontier labs, it is this impression of their composition as a product that makes me feel, constantly, whenever I am interacting with them, that they are less a software product than that they are a grift, a scam designed to make me feel like I am interacting with a product that has capabilities that it simply does not, to try to lull me into a false sense of security that I can trust it.
The frontier labs are of course the worst offenders, but every criticism here applies just as much to Ollama, which (if anything, due to the obviously poorer quality of the available models themselves) needs these features even more than the frontier labs do.
Here, I will set down a few features that might convince me that an LLM-based product, particularly one focused on research or software development, was actually serious about helping me do useful things with it.
Make "Checking For Mistakes" A First-Class Feature
This is the biggest issue, and the major reason that I was inspired to write this post.
It is a truth universally acknowledged, that AIs cannot reliably provide information.
I could cite a ton of news articles and studies about this fact, but there is no need. Every single chatbot admits this, up front, in a fine-print disclaimer as a core part of their user interface. Gemini says "AI can make mistakes, so double-check responses", Claude says "Claude is AI and can make mistakes. Please double-check responses.1" ChatGPT says "ChatGPT can make mistakes. Check important info.".
Every time I see that last one, I wonder how I'm supposed to know what "info" is supposed to be "important".
All of these warnings are all small, gray text, painfully obviously included as legalese to push responsibility back onto the user rather than to help with anything. This is a core limitation of all these products. Checking their output is a part of the workflow for using them that:
- you absolutely cannot skip or skimp on without creating risks to yourself and whoever you are conveying its output to, and,
- it is very easy to skip or skimp on and you are encouraged at every turn to do so, because "just trust the output" is one of the quickest ways to save time.
A chatbot product that took this weakness seriously, as an actual consideration for using it, would put a checkbox next to every claim in its output. It would be a 2-column worksheet, where you've got the LLM output in the first column, and next to it, human notes in the second column, explaining what work went into checking this claim, and a big checkbox that you would only check off after you believe you'd checked its claims thoroughly enough.
Coding assistants would need to have some version of this as well. Right now, this is pushed off into code review, which means it is a dark pattern which subtly encourages the "author"2 to offload this work to their code reviewer without ever looking. Once again, "it's probably fine, I don't need to check" is the quickest way to save time and churn out those PRs faster.
It might even be useful for coding harnesses to have some affordance for checking code before it even runs tests. As the vendors themselves have admitted, it's not just expensive to burn tokens on your "AI", you also end up burning far more compute on the AI. Being able to check your diffs before sending them over to uselessly exhaust your testing compute cluster would be useful.
If your product tells me that it makes mistakes and I must be the one to check for the mistakes, but then gives me zero tools to check for mistakes, I cannot take it seriously.
More Citations to Check, And More Details
Most chatbots prefer to give an answer, rather than a citation. In my own personal use, I find that when asked to provide a list of citations with clearly marked sources for each one, they will appear to "get bored" halfway through the list and simply stop including citations at some point.
When the bots include citations at all, present them as inline annotations that say nothing but the domain name of the search result, in a font so small that it's barely legible, and an equally indecipherable icon that is fewer than 16 pixels on a side.
This is backwards.
Now, I am aware that these citations do come from somewhere, and in an attempt to reduce hallucinations, all of the major providers support some form of "grounding"3, and that those little barely-readable citation links are referencing actual structures in the RAG pipeline and not just potentially-hallucinated tokens, but I'm not talking about the underlying machinery in the model, I'm talking about the presentation to the user.
Plus, regardless of whether a snippet of text came from a RAG query, we know that LLMs can never provide an authoritative result; it's a fundamental limitation of the technology. They can still garble the results of RAG as much as they can misrepresent any other training data. This means that it must never present its results as authoritative.
If you ask an AI to do research queries, every result should be presented as a list of citations. Moreover, the presentation should display each citation as a large object of in its own right, with clearly identified metadata, including not just the site where it was found but its publication date and, if possible, the name of the author. The literal, unmodified quotation (not from RAG, not a summary: a quotation extracted with a regular program and not an LLM) should be front-and-center, larger than any AI-generated text.
If the AI product wants to editorialize or summarize (which should not always be necessary!), the AI-generated text should be presented as small text underneath the citation that has been found, de-emphasized as much as the disclaimer is right now, at the very least until the user has verified that the summary is accurate. Perhaps, for a research project, a "did you read the citation" checkbox might even be helpful.
If your product openly tells me that it will scramble, misrepresent, or omit its citations in its summaries, and I must read the original human-authored citations to be sure, but then gives me no tools to track my reading of those citations or even any way to find them, I cannot take it seriously.
No First-Person Output, No Apologies
There is no reason for a software development or research tool to use first-person language to describe itself. They should not do so. In fact they should not be allowed to do so.
There is also no reason that they should ever apologize. It is a waste of everyone's time; it's a waste for the chatbot to generate the apology, it's a waste for the user to read the apology, and it's a waste for the user to respond to the apology. Yet they unfailingly do this upon every correction.
The vendors of these tools know that they are routinely causing mental-health crises. In response, they have added non-functional "guard rails" that can still, in 2026, easily be bypassed.4
A product seriously interested in helping with productivity would correct this glaringly obvious flaw, focus on the task at hand, and stop emitting useless verbiage.
In the previous two sections, I tried to focus on ways in which the harness would be constructed differently even if the LLM technology is fundamentally impossible to improve; in this case, I have to assume that the labs have some control over the model itself. But unless they are truly incapable of influencing their output (and all their "benchmarks" and "capabilities" seem to indicate that they can control it very tightly) they ought to be building models that are much less verbose.
More Non-Natural-Language User Interfaces
Although natural language could hypothetically be a powerful interface for interacting with a computer system, the practical upshot of LLM natural language interfaces is that these interfaces are imprecise and repetitive, full of superstitions masquerading as "best practices". The inputs are a mess and the resulting outputs are a mess.
The general way of addressing this unstructured mess is to allow the chatbot to directly take action in response to the user's input; in other words to supply it with "tools" via an MCP server. But again, this is backwards. If we cannot even express our intent clearly in the first place, why are we trusting this system to take potentially destructive and harmful actions on our behalf?
Instead, I would expect a product that was seriously invested in helping me accomplish specific tasks, to have user interfaces specific to those tasks. Is it supposed to be able to be a security scanner that can discover OWASP top 10 bugs in a codebase? Have a button for that. Build that functionality into your harness, train it directly into the model, use smaller models that can satisfy that functionality more effectively than throwing it at the planet-sized brain of Fable or whatever.
I'm aware that there are small software startups that do something like this, but they are bolted on to the side of the main model providers' APIs, not integrated into the core of the product and not using their own models and AI systems to achieve consistent and repeatable results.
Strong Data Provenance Indicators
Chatbots produce data tables pulled from websites, from APIs, from MCP tools or from summarizing and scrambling the user's input. In order to provide the illusion of a seamless interface, this data is presented in-line regardless of where it comes from. But some of these outputs are produced mechanically via regular old API calls, for example, from the result of calling a tool or querying a website, but presented uniformly.
But there is a huge difference between an authoritative data source being inlined as part of a chatbot conversation, being treated as input by the chatbot, and some ad-hoc hallucinated data being treated as output of the chatbot.
If a product is trying to help me make accurate, empirically-grounded, data-driven decisions, the source of the data is critical.
Integrated into the "check for mistakes" and "verify citations" workflow I described above, there's a necessary "verify data programmatically" pass as well; to have tools that will treat portions of the output as a regular spreadsheet, allowing regular-old computer arithmetic to verify things and showing where such arithmetic was used, and how.
Better User Control of Reproducibility
Anyone familiar with the technical specifics of LLMs will know that they have a variable called "temperature" which controls the degree of randomness that the LLM uses to produce its outputs. But most users don't know this, because it isn't exposed as part of the user interface by default.
This leads to a subjective impression that you asked ChatGPT, and you got ChatGPT's authoritative answer.
You can't just set the temperature to zero and still get useful results - I am aware that it does more than just scramble the output at random, and there are perhaps good reasons that simply exposing just a temperature setting would not be that useful to users. But if we followed some more of my earlier recommendations for making more structured UI elements to solve specific problems rather than having long back-and-forth chats where each refinement depends on the previous response, perhaps those elements could also re-play the process so that users can see how reliable the bot is at a particular task and develop a sense of how the stochastic nature of the process actually affects it.
Similarly, if a user is trying to solve the same problem repeatedly with a chatbot, and the chatbot product has numerous computational tools that don't really have anything to do with the LLM, such as deterministic data-processing tools, then having a way to freeze the non-deterministic parts of the transcript but re-populate a particular data frame with updated information and fork / continue the conversation from there would be a way to avoid introducing pointless additional randomness when you already know what tool you're trying to use.
The fact that every conversation is presented as this flat chat prompt that doesn't let me interact with any of the widgets that were previously produced except through more chatting, really makes me feel like the whole product is just doing predatory social-media style "increase time on site" optimization, just trying to lure me into further repetitive and unreliable chats, rather than letting me get in, solve my problem, and get out.
Context Visibility
Managing the LLM context is the ongoing challenge facing organizations that are trying to use "agentic" workflows. Filling up the context with too much information causes well-known problems. In response, advanced LLM users attempting to solve larger problems must break up very long prompts into "skills", give access to lengthy information via "tools", and delegating sub-problems to "sub-agents" rather than simply extending a single prompt indefinitely.
All of these strategies have flaws, because even on the largest models, compared to the breadth and depth of knowledge-work problems, LLM contexts are quite small.
And yet, none of these products will show the context to the user by default. There are third-party addons that can show you a simple progress bar but for addressing the premier engineering difficulty with this technology, that is below the bare minimum.
This lack of visibility means that almost all of the tools for extending the context are flying blind. Rather than responding meaningfully to a full context, everyone just kind of guesses how much state they need by guessing and trying over and over again with progressively more elaborate skill and sub-agent layouts. Even managing context compaction ends up being an advanced API-driven workflow5.
A serious product that was trying to help the user understand would not only show "available context" but explain the impact of context compactions, make it easier to see harness-generated prompts, and so on. This would be a first-class feature, combined with the aforementioned reproducibility / replay tools, would allow users to do real experiments to develop an understanding about how to make good use of the context window.
A Sandbox That Actually Works
I've been focused on the chatbot interface here because it is the most immediately egregious upon looking at the UI. But the "agentic loop" tools used for coding are equally dangerous, if not more so. Coding tools keep destroying everyone's data, over the course of years.
These catastrophic incidents that become front-page news are relatively rare compared to the amount of coding-agent use out there. But they also aren't the only kind of sandbox violation. Coding models will so routinely edit test code instead of the system under test that there are "pro tips" articles all over the web giving you the flawed advice to simply ask the agent not to cheat. News write-ups of the catastrophic incidents themselves will also offer glib and wrong advice, like "use a docker container". That might prevent it from literally deleting your operating system, but it won't prevent it from destroying all the local work you have in your codebase (it needs access to a checkout, after all!)
There is a flurry of activity in the infosec space where people are rushing to plug the gaps left by these coding harnesses. Everyone's got their own version of an MCP approval gateway where you can optionally place a proxy between your agent and your production infrastructure.
In the best case, though, all these mitigations and proxies and prompts simply turn the user into an auto-approval automaton, hitting Y, Y, Y, Y over and over again, until you finally are driven mad and hit "yes to all", turn on full-auto mode and submit yourself to the void. With nothing between your personal vigilance and disaster, there are no workflows left beyond decrementing your own vigilance until there's nothing left and then hoping the disaster never arrives.
The fact that some mitigations exist that can be deployed by extra-cautious users does not change the fact that "agentic coding" is an unsafe-by-default technology deployed without concern or guidance. Every frontier lab has tied a spring-loaded shotgun to a dog; the fact that dog owners can publish thoughtful blog posts explaining how you can teach your dog the basics of gun safety or how you can have your dogs play in a bullet-proof room does not mitigate the fact that the product should not have been allowed in the first place, nor should it continue to exist without VERY strong security controls.
I might believe that a frontier lab were seriously interested in providing developers with a useful tool if they shipped something that had safety built-in.
That means tools in the harness, detached from any LLM, independent of the prompt, that could:
- sandbox all filesystem operations and strictly limit ANY deletions outside of specified scopes, regardless of operating system,
- enforce snapshotting of the entire repo on every operation for easy rollbacks and minimal lost work,
- remove the disaster of "auto mode" (not to mention nonsense like
--dangerously-skip-permissions) entirely, and - carefully consider a structure for presenting plans to the user where, rather than provoking immediate alert fatigue by asking for checks on every action, make structured plans which can be submitted to the user as a group of actions and reviewed and approved as a batch.
In the same way that I suggested above that research-based tasks should have a way of re-issuing prompts to determine how reproducible a result is, or whether other sources might be found, agent-based tasks should have a way of being executed against mock services for popular APIs, so that the verification can match both on the front-end (review the plan for making the API calls before they're executed) and the back end (review the API calls that were issued to the mock service and verify that they matched).
Instead, the frontier labs provide us products that are disasters out of the box, give us "best practices" to build massive and elaborate, as well as incomplete and error-prone, security perimeters of our own design. Then they blame "operator error" when it inevitably goes wrong. I cannot believe that these design choices are intended to help us be productive.
Bonus: Human Processes
Organizations deploying AI also frequently come across as unserious, for similar reasons. In 2023, naive exuberance could perhaps be forgiven. But today, as we near the close of 2026, there are several well-known problems, that have been extremely well-covered in the press. None of these things should be surprising, but most orgs deploying these tools are still just letting them rip and hoping it all works out.
Organizations deploying these tools would need at least three kinds of major modifications to their internal processes, if they wanted to be serious about using them safely:
1. Shift Rotations to Prevent Vigilance Decrement
There have been several high-profile incidents where software developers' gradual acquiescence to accepting LLM output have lead to serious economic consequences for the companies deploying them, perhaps best typified by Amazon's "millions of lost orders" due to a gradual decay of their engineering processes from LLM use.
These outages, and other AI-related failures, are due to the difficulty of maintaining focus on the same problems. In other words, as I described above, vigilance decrement is a constant problem, because AI outputs are most often correct, but continue to be incorrect in surprising and non-intuitive ways. As I have previously written, you cannot trust yourself to catch every bug with code review, and LLM output.
Aviation, for example, has very strict rules around rest requirements. There is also a specific rule that "No certificate holder may operate an aircraft without a second in command if that aircraft has a passenger seating configuration, excluding any pilot seat, of ten seats or more.". Other safety-critical professions have similar rules.
And yet, even in the age of the supposed "AI revolution", most software teams are still assigning every engineer a full feature load, not planning for any rest, and telling people to review code whenever they happen to have some "free time".
Maintenance of vigilance has to be your top priority. Regular, scheduled, inviolable rest periods where people do work without AI assistance, and are not exposed to any AI output for review or otherwise, would be crucial in order to stay mentally sharp enough.
The tools themselves should have this sort of thing built in. The mistake-review process described above should have a periodic spot-check mode where a second reviewer periodically reviews a chatbot log, doing their own independent verification of claims, to see if they spot the same errors. This could provide a feedback loop to determine how much rest is necessary to maintain continuous attention and actually spot hallucinations.
2. Skill Practice To Prevent Skill Loss
It is also well-known that AI use leads to AI reliance, and AI reliance leads to skill loss.
I like to use the analogy to dockworkers at a seaport6 adopting automation.
If you employ dockworkers to load and unload ships all day long, they are going to be getting tons of exercise. They will be able to lift heavy objects on demand, whenever. They might have plenty of health problems and injuries from this type of work, but "lack of exercise" will not be a problem.
With the development of standardized container ships and mechanized cranes, you are going to be changing their job description substantially: now they mostly spend all day sitting in a small cubicle moving a control lever back and forth, not lifting heavy stuff. They will get worse at lifting heavy objects.
In this analogy however, the cranes are not all that reliable. We know they break, and they drop their payloads sometimes, and the stuff needs to be manually moved. But this only happens a few times a week, at most. If you need whoever is driving the crane to be able to jump out at any moment and still move stuff around manually, then you need to make an affordance for that. You need to give them time to go to the gym and do some lifting for practice, or every crane failure is going to be a major emergency.
An organization doing an AI transformation would also need a massive increase to learning & development budget, both in terms of resources and in terms of schedule. If your people are going to lose skills because they've lost regular practice in the incidental course of doing their duties, then they are going to need deliberate, intentional, non-incidental practice of those skills to keep them sharp.
But rather than trying to accommodate new workflows and give time for people to adjust, most AI mandates are simply dropped on workers like a ton of bricks, with no time to adapt and no affordance for maintaining their skills. Operate the crane and stay fit and healthy and ready to switch back to manual lifting at any time and then get back in the crane cockpit right afterwards. Don't mess up.
Then an accident happens and everyone is surprised, as if this process weren't practically designed to produce a terrible result.
3. Mental Health Resources to Deal with Mental Health Risks
AI psychosis often begins with practical problem-solving, and beyond that, it can start specifically at work. Not to mention the more pedestrian condition of "AI brain fry".
If you are mandating your employees to use a hazardous tool that may seriously and directly damage their mental health, you need trainings and resources. You need in-house therapists and you need to be making sure to check in with people actively to make sure that this is not happening.
Again, the tool itself ought to have some way of dealing with this. An occasional "take a break" popup is easily dismissed; they need a user-visible AI personal dosimeter so you can see your cumulative usage over time.
I don't even know if "usage over time" is a sufficient metric to gauge risk. Maybe if your work chatbot start to talk about resonance too much, unless you literally work as an acoustic engineer, that should be flagged for someone.
We are, again, years into dealing with these tools, and we know these risks exist. Yet no serious mitigations are provided. Not even any way of measuring the risk exposure.
And More
There are also many other risks associated with the technology. There are intellectual property risks with the foundation models, due to recklessness with their training data. There are existential financial risks associated with the infrastructure build-out. The extent to which most "open" models are simply derivatives of frontier models is an open question.
What I Think
If any one of these things were regularly overlooked by AI vendors or users, that would be a totally normal product oversight. Room for improvement for the next version, but nothing catastrophic.
Shipping without any of them doesn't seem like lean product management, it seems like a careless attitude towards risk and a product design philosophy oriented entirely towards short-term demos, with no regard for how to realize actual productivity gains.
Furthermore, being available for years without anything like these features, despite hundreds of incidents demonstrating the risks, with hundreds of billions of dollars of funding, makes it seem to me like if they were to add all the features that would make their product actually safe and hypothetically useful, these features would reveal that it is actually not an improvement to productivity.
In the year since I first wrote about measuring the cost/benefit ratio of AI, I have heard from numerous people who have shown this to management to try to illustrate why their AI initiatives - like almost all AI initiatives - were either failing or burning out their engineers.
I've also heard from lots of people that have told me that it's obviously useful and they don't need to measure so carefully, because they are getting lots of work done that they couldn't have otherwise.7
I have yet to hear from a single person who has said "yeah, we measured according to your methodology8, and it turns out that our AI work is going great and that our ratio is 0.75".
Obviously, I cannot say for sure why this is; absence of evidence is not evidence of absence. But at this point I think the null hypothesis is that AI tools provide, in aggregate, zero value. They make mistakes too often, and the externalities they produce are so bad and so difficult to control that even before we get to the places where they are just physically poisoning people, even the negative effects on their direct users end up cancelling out whatever benefit to they provide to their organizations.
If I were wrong, then including tools to measure an AI's effectiveness at the tasks their users are actually trying to accomplish, rather than meaningless benchmarks, would show big productivity gains. The frontier labs would be champing at the bit to add such features, and crowing about their fantastic results.
I think the labs know that if they did that, it would present a grim picture to their users. Such tools would let their users see that it's making mistakes much more often than they realized, that they're spending much more time with it than they want to be, and that it's just generally not fit for purpose.
If they prove me wrong by adding in all of these safety mechanisms, and in the process, they make all of their AI technology less harmful, I'll be thrilled to be debunked.
Acknowledgments
Thank you to my patrons who are supporting my writing on this blog. If you like what you've read here and you'd like to read more of it, or you'd like to support my various open-source endeavors, you can support my work as a sponsor!
-
It is also interesting that for the next section, sometimes it seems that Claude's disclaimer is "Please double-check cited sources." instead. ↩
-
... by which I mean the "prompter", since authorship is not what's happening here. ↩
-
Claude has the "citations API", Google has various different kinds of "grounding" against its own APIs, and I guess Microsoft can check OpenAI's homework if you want. ↩
-
Given the relatively slow speed of the justice system and the mainstream press around the world, we probably will not hear about whether people are managing to incidentally break through these guard rails to self harm right now, but there are no shortage of stories still being reported right now where people were still doing just that, such as in this story where the effect of the much vaunted "guard rails" in 2025 was that if you wanted it to write you a suicide note, it would refuse twice but acquiesce on the third try. I don't see any reason to believe this fundamental issue has been addressed in the meanwhile, since it had been happening for years at that point. ↩
-
In this tutorial we can also see an incredibly rosy scenario presented, where a long-running workflow effortlessly compresses all of the necessary information into the new context, even if it uses a lower-fidelity model to do so, rather than the tangled and gnarly problem of problems which really are too big to fit in the context, which is to say, "most real-world problems". This presents the context limit instead as a minor speedbump to be worked around rather than the fundamental flaw in LLM tooling. ↩
-
A heavily fictionalized seaport. This is not how actual dockworkers work. This is a simplistic metaphor about incidental benefits of instrumental tasks, it is not supposed to delve deeply into the mechanics of maritime shipping. In particular I know that cranes are more reliable than this and this is not actually how you would respond to a crane malfunction anyway. Feel free to share fun facts about maritime shipping if that is your special interest but please do not @ me to correct this metaphor. ↩
-
To my knowledge, none of their publicly-traded employers have posted a measurable improvement to efficiency outside the margin of error. ↩
-
Or any similar methodology. I don't need people to adopt the exact practice that I proposed there. ↩
28 Sep 2026 4:27am GMT
25 Sep 2026
Planet Twisted
Glyph Lefkowitz: Who Is Open Source About?
Open source is, at least in part, about you, where "you" refers to the user.
Open Source Is Not About "Open Source Is Not About You"
In other words: Rich Hickey was wrong when he wrote "Open Source Is Not About You" and I'm tired of pretending otherwise.
Of course he's not completely wrong, or his famous post would not have resonated quite so much in the first place. Obnoxious users who demand their personal use-cases be immediately addressed by volunteer maintainers for free should indeed be viewed as the pariahs that they are. Similarly, corporate users who want free support from the community that supplies their infrastructure to lower their costs. As should those who profit from this type of externalization by their own customers.
But the exchange of "open source" (or even "free software") is not as simple as "I have prepared some software for you, please enjoy it, you have no right to complain", and maintainers ought to have a precise understanding of the costs and benefits - as well as the ethical implications - of that exchange.
Right now we barely even articulate that the exchange exists, let alone that it establishes a long-term, subtle, and implicit relationship between maintainer and user.
Let's fix that.
A Brief Aside about Meta-Ethics
When we talk about "obligations" and "rights", of "shoulds" and "musts", we are constructing an ethical system. The purpose of such a system is to develop social expectations and social consequences. There is not much use in me telling you that you are transcendentally evil for failing to follow some arbitrary recommendation that I have. But I am implying that I believe there should be consequences for your behavior. I am also implying that there probably already are some consequences, and they're just not written down anywhere yet.
Therefore, a post like this, where I say that we should view our social obligations in a certain way, that is the beginning of a broader social conversation. I think there should be some consequences, so I am gesturing towards that possibility. Exactly what consequences?
For now, I'm not sure. Let's figure it out.
What Are We Doing When We Do An Open Source?
Hickey, and his many acolytes in the years since his fateful post, asserts that the process of "open source" goes like this:
- Maintainer makes a thing, and makes it available to users as a gift.
- Maintainer may "love working with the team".
- Maintainer may be "proud of the work we do".
- Users accept the gift, and extract utility from it.
- (Users MUST be grateful for this.)
- A tiny fraction of users reciprocally contribute to the thing.
- (Maintainers may be grateful for this.)
He makes various oblique references to the specific activities of his company, which does things vaguely related to his projects for money1. These activities are exclusively characterized as for "customers", however, a subset of the aforementioned users so tiny ("fewer than 1%") as to nearly be an entirely distinct group.
Breezing past this process in an essay about obnoxious users demanding things they are not entitled to, one might nod along, as this sounds mostly sensible. Giving gifts is nice. I too love working with good teams and taking pride in things.
Examined more closely, however, it starts to logically fall apart. If you have consulting clients and that's where all of your money is coming from, why are you bothering (as he repeatedly insists) "doing [things] for the community"? What was the point of releasing this code in the first place? You could love working with your team and be proud of the work that you do in a lot of different contexts; why bother implicating this horde of entitled and obnoxious people, if that's all you're getting out of it? What's in it for you?
If we've left out something as fundamental as "why is the maintainer doing this", perhaps this story leaves out some other important bits as well.
Why Are You Doing This?
There are many possible motivations for releasing and maintaining open source software. They are often subtle, often overlapping, and rarely clearly stated. Maintainers are not a monolith and not everyone does it for similar reasons. But let's review a few reasons that someone might want to contribute.
Reputation
One reason that you might want to release some open source software is advertising. The most common form of this is self-promotion; if you are a visible, prominent contributor to an open source project, it stands to reason that you will have an easier time finding work in the domain of that project.
If you operate a consultancy, as Rich Hickey did at the time of his famous rant, then this reputational currency translates into advertising for your services. It's a practical demonstration of the skills of your team.
The trade in this benefit is most like the traditional "gift economy" that open source has been compared to. You give the code to your users, which has some value, but the users give you back some reputation, in the form of their attention, their esteem, and possibly even their money if they become customers or employers.
Influence
Infrastructure is the most popular type of open source for a good reason. Programmers working on a problem are often hemmed in by sclerotic architectural choices which prevent them from solving problems in the way that they'd prefer to solve them. Major infrastructural investments are difficult to justify in a planning process, as their benefits are hard to prove. Sometimes the benefits are highly personal; different engineers have different aesthetic preferences about what types of equally-valid solutions they'd prefer to work with.
If you can develop your preferred type of solution and release it as open source, then you can influence how everyone else solves this type of problem. As an individual, such a position of influence can allow you to have some transferable expertise between employers. You know how to use the tool you developed, so you can be very quick and effective with it, and you can shape it to your ongoing taste over time.
If you're an employer, and you can get everyone else to use your open source thing2, this can reduce both your hiring and training costs. Potential employees can read the code, see that it's good, and want to work at a place that produces good code like that. They can also read the code and become familiar with it in advance of coming to work for you, which means that you have a ready supply of developers who already know how your internal systems work.
The trade in this benefit is more like "soft power" than a gift economy. You give the code to your users, which has some value, but the users give you back the ability to dictate their technological agenda. You gain both the ability to influence their initial direction, and, as part of ongoing maintenance, to dictate their behavior over time.
Improvement
As an engineer, you might want to improve your own skills. Writing something proprietary and commercial cuts against this in two ways.
First, you will want to build something that already exists within your skill set, so that it will attract commercial interest and actually be competitive. Within the context of a larger team, you will want to personally be able to be immediately effective for similar reasons. But you still need a way to learn new things.
Second, you will want to build something somewhat secretively, so that the value you are producing is captured rather than released to the community. This means that you will be cut off from external sources of expert feedback.
As an organization, you might want to build the skills of your staff in similar ways.
The trade in this benefit is code for knowledge. You release the code or changes, and in return you expect your users to provide you good bug reports, and to induce at least some of them to become co-developers.
Outsourcing
As an engineer, you can only do so much on your own. Perhaps you want to have some influence over your infrastructure so you want to write it, but you also want to have a communal place to keep your infrastructure such that you can make a change to something to suit your needs, but you know that even if you walk away, someone else will maintain that change and keep it working across years or even decades of changes to underlying platforms, hardware, etc.
This sort of communal maintenance effort can be shared among all interested participants; if a thousand companies all need the same tool, if even a few dozen can share it, that reduces even their own load massively, let alone everyone else's.
The trade in this benefit is more complex, since there's less symmetry between the main maintainer and peripheral community members who also contribute code. The main maintainer is actually trading a namespace, a central place for people to contribute, coordinate, and release changes, rather than the code. They are a sort of market maker where then all the other contributors trade code for code within that market-ish structure.
In practice, this motivation produces a game theory problem where, when maintenance drops below a critical threshold, it creates a big enough crisis that at least some freeloading stakeholders will be forced to start making contributions.
Ultimately, however, this saves all involved parties a ton on maintenance, more eager volunteers who do not freeload in the first place get all the other benefits mentioned above as well.
A Brief Aside about your Chart of Accounts
Most companies account for open source maintenance work as simple overhead on ongoing projects. Sometimes it's CapEx, sometimes it's OpEx, but it's just "whoever happens to be working on this thing to support whatever random product it's a part of".
This type of accounting creates distorting incentives, because it doesn't recognize all the benefits above. Under such a fiscal regime, ongoing healthy maintenance becomes a ZIRP because when resources are more constrained, this apparent indulgence gets corrected.
The ancillary benefits that open source creates ought to be properly recognized. It shouldn't just be buried as Wages or IT or whatever. If it's helping you hire better engineers, some of that expense should be allocated to Recruitment Costs. If it's materially improving your reputation among your customer base, some of it should go to Goodwill. If it's getting your product in front of developers who are your customers, it should be in Marketing. Most importantly, if maintenance on an open source project is actually helping you maintain your enterprise-wide platform, it should not be squirreled away in some small team who happened to be the first one to adopt it.3
Exactly how these costs should be allocated and cross-charged to different departments depends heavily upon your organization and your specific chart of accounts. But "whatever, it's just part of the software product" or "I guess it's DevRel because the SDK is in there" is guaranteed to have your open source organization destroyed along with all those side-benefits the next time that there's a cash crunch.
The Things that Aren't Supposed To Be Benefits
These categories could be made as explicit, rational trade-offs, even if they are often implicit and subtle in practice. They are transactions where the maintainer gets something and the user gets something.
However, not everything that you are getting as a maintainer is something you are actually supposed to use to your own benefit. Being given trust in service of a responsibility is not a transaction.
"Oops, All Root Shells"
Open source code is code. In our modern world of absolutely pathetic sandboxing, installing code from somebody else gives them control over your system, even if it is somewhat indirect.
There is an unwritten rule that if I create an open source library, and you use it, it probably shouldn't have a backdoor in it that gives me the credentials to your bank account. There is a trust relationship between the user and the maintainer, and here, we see the first obligation that the maintainer has. The maintainer is obligated not to use the user's computer for their own gain.
This rule might seem obvious and straightforward. It might even seem unfair to you that I call the rule "unwritten", because the rule is, in fact, written down in a few places: for example, in the npm Acceptable Content Policy, it says right there:
A few examples of unacceptable content:
…
- Content containing malicious computer code, such as computer viruses, computer worms, rootkits, back doors, or spyware. This includes content submitted for research purposes. Tools designed and documented explicitly to assist in security research are acceptable, but exploits and malware that use the npm registry as a deployment or delivery vector are not.
I think we can all agree that a script which steals your bank credentials and sends them to me to buy a totally sick jet ski would qualify as "malware", so clearly that is forbidden.
There is also an enormous gray area here. npm also explicitly allows "Information on how to pay, donate to, and otherwise support Package development", but then goes on to explicitly forbid "Packages that display ads at runtime, on installation, or at other stages of the software development lifecycle, such as via npm scripts."4 How are the lines drawn around these gray areas? "npm will continue to apply its judgment when deciding what content is acceptable."
But also... this is forbidden by npm, not by the transcendental nature of "open source". I could give away code that displays all kinds of ads to its users as a "gift" on my website. The exact structure of this policy is not uncommon, but it also isn't exactly the same as other such sites. PyPI, for example, explicitly bans "cryptocurrency mining", which NPM does not. Is cryptocurrency mining "not open source"? A lot of judgement calls are happening here about what is allowable in these "gifts" that you are giving to your users.
But I digress.
My point is that policy-making around this concept is not clear, there are lots of little disagreements around the edges, but there is a very strong consensus that while the user is giving you their trust here, that is not a trade. The deal is not "you give the user some code, the user gives you unlimited compute and access to all their financial accounts". The user has made themselves vulnerable to your code on the strength of your reputation.
This creates an obligation for you to not do anything evil with that code, either intentionally or through negligence.
Security Updates Are Just Command And Control In A Funny Hat
All of this is just about the initial download of some code, and that is the way that Rich Hickey describes it, as if you just grabbed some code off a web page and put it in a folder that you like on your desktop. But that is not how open source relationships work today, if indeed it ever was.
The way it works today is that you add a dependency to your pyproject.toml or your package.json or your Cargo.toml and now your users are vulnerable not just to whatever you happened to upload in the first place, but to whoever happens to have your package index credentials.
This creates an obligation to maintain an operational security posture that protects your users from malicious updates.
The Roadmap Is Someone's Life
Another kind of trust that the user is placing in you is the trust that you are going to have at least some kind of regard for their usage of your software.
In a perfect world, the user's expectations could be clearly circumscribed. Whatever ongoing maintenance you commit to perform would be encapsulated in clear policies that you'd write up in advance, about exactly what kind of security response policy you have, how you will communicate when you no longer have the resources for maintenance, and so on.
But anyone who has been involved in any project at anything but the most extreme tier of operational maturity knows that 99% of the ecosystem relies on a set of loose conventions around how all that stuff works. We expect that maintainers will generally be around, that they'll use existing tools like an issue tracker for triaging user bugs, GHSA and CVEs for security reporting, that they will mark the project as "archived" and maybe do a final release before abandoning it, that they will maintain a ChangeLog explaining at least a little bit of what is going on.
Users assume that those conventions will be followed when there are any gaps in explicit policy, or indeed if policy is lacking entirely. This assumption is reasonable, because otherwise nobody could ever use any open source without a stack of service contracts that nobody has any time to write.
The strongest such convention is that an actively maintained program will, at least, more or less keep doing what it does as time goes on. A user who has elected to use a bit of open source software has made themselves vulnerable to changes and breakages in that software by the mere fact of using it. In the time that they have used it and invested in it, they have not invested in:
- creating alternative software to meet their needs,
- maintaining data in formats that other software can read, or
- learning how to use existing alternative software.
This can, and does, go badly wrong, when those expectations are mismatched.
How It Goes Wrong
Let's say a maintainer creates an open source paint program, OpenPaint.
An artist, known for their unique style of making blended collages, switches from their previous app, ProprietaryPaint, to this new OpenPaint to make these culturally significant works of art. However, the maintainer decides that the 'blend' tool is kind of a pain to maintain, and they remove it in OpenPaint 2.
A few months later, the artist's operating system vendor issues a security update that breaks OpenPaint, because older versions of OpenPaint were unknowingly abusing some platform API.
The maintainer releases a new OpenPaint 2.0.1 that addresses this incompatibility, but doesn't care about version 1.x any more so they don't bother to update that one.
This places the artist in an impossible situation. They can stay on an old version of their operating system, putting all their personal data at risk. Or they can upgrade to the new operating system, effectively either cutting off access to their livelihood, or forcing them to change their art style entirely.
Now, proprietary software can place users in similarly untenable positions (and in fact, it is more often proprietary software that does). But does the openness completely remove any obligation for this consideration? Should the OpenPaint team have to at least communicate the reasons for doing this, to give the artist some recourse?5
The only thing that "open source" does is that it allows the artist to pay a prohibitive amount of money to a new maintenance team to create a fork. This is rarely the kind of thing that individuals can manage.
This creates an obligation to at least consider how your users might be relying on you.
This is the most complex obligation of the bunch. Obviously it does not entitle every single user to infinite work from the maintainer, but it also shouldn't entitle the user to nothing for having trusted these subtle implied claims that the maintainer is making by making their work public.
It is a nuanced and ongoing negotiation and I do not think we have a clear moral intuition about how it should work out. But we do need to figure out a way to work it out.
It also raises a clarifying question.
Why Are We Even Doing This, and Who Are We Doing It For?
People generally like to do things for more than one reason. We live in an economy where people need to make money, but we mostly prefer to make that money doing things that are useful, and that make other people happy.
So, yes, we create open source for self-interested reasons to improve our reputations, to improve our skills, to increase our influence and to share our maintenance burdens. In so doing we take on some level of obligation to not abuse the trust that is placed in us, even if that level of obligation is not clear.
But if we are not doing it to serve those users at least a little bit, then those motivations are going to quickly ring hollow. We will not increase our reputation with a person if we respond to their every request by telling them that we owe them nothing and that their opinions are worthless. We will not gain influence over a community if we ignore their desires.
Many interactions with open source maintainers are unnecessarily adversarial. This is of course partially the fault of those users, who should calibrate their expectations appropriately.
Still: maintainers could do a better job of listening before these interactions become toxic. There's no reason that "open source users" should be an especially toxic group of people. At this point in history, that group is basically just … people with computers.
It's like that old truism. If you meet one person who is a jerk to you, that's their problem. But if everyone you meet, everywhere you go, is constantly abrasive to you and treats you like you're doing something wrong, maybe it's time to look inward.
If all open source users are entitled assholes, maybe it's time to look for a structural problem.
Surprise, It's About AI Again
Sigh.6
Users hate slop.
I know, dear AI-positive reader, your AI outputs are different from everyone else's, you aren't pushing thoughtless slop into your code, just because everyone else is and it is the inevitable terminus of using those tools. You aren't "lazy vibe coding" with Claude, you're doing "responsible agentic engineering", which is different because you're just built different.
Still, humor me, for a moment. Your users don't know that. They know what it looks like when products that they like adopt slop. They know that they will start leaking data. Developers know that it will make them personally less secure. They know that they can expect more outages and that your code will inexorably decline in quality.
In other words, your users are going to assume that this means you are violating that final obligation that the software should keep working.
Your users are going to tell you to stop, and they are probably going to get mad. Maybe you, or a plurality of your team, also want to stop, maybe you disagree with them, but in any case you need some way to have that conversation in a way that does not immediately overflow into every adjacent discussion forum. Users need to feel welcome in some space so they can have the discussion in that space, and not explode out into a thousand different group chats and social media threads.
This post was inspired by yet another prominent open source community discourse where a ton of angry users showed up to yell at developers to stop accepting LLM-generated code. I'm not going to link to any of these, because we don't need any more fuel for the discourse fire. But there is more than one such case and the pattern is becoming familiar.
On social media - usually BlueSky or Mastodon, but sometimes a user group forum - users become aware of some AI-adjacent policy. They show up in a horde to the developer forum or mailing list. They loudly start demanding the project take a hard stand7 against AI. This pressure is simultaneous, but uncoordinated; extremely repetitive, very diverse, often inconsistent, and pretty stressful, especially if you're a burnt-out maintainer with other things to be doing who may not even like AI yourself in the first place.
Believe me, I get it. It can be very unpleasant to deal with.
Like most problems that AI is causing, though, it's not really an "AI" problem as much as it is a pre-existing dumpster fire that "AI" is pouring gasoline onto. In this case, an online mob is the language of the unheard8.
If Users Are Mad It's Probably Already Too Late (But Maybe You Can Get Ready For Next Time)
One day, all of a sudden, you're getting feedback from a bunch of users that are using inappropriate channels to complain. But did they already have appropriate channels to use?
Did you have a place for people to congregate and discuss your project? To make orderly complaints in a way that will be legible to you? Or do you just have a GitHub Issues page, which non-technical users have no idea how to interact with, and a forum for developers, where users don't know the norms and any arriving brigade of pissed-off users will be seen as disruptive and inappropriate?
I don't want to be throwing any stones from within my particular glass house. Setting up such a place has gotten harder over the years. I don't really have one, either.
Could I have one, though? IRC has been slowly dying, mailing lists are unpopular and present increasingly annoying moderation challenges, forum software is expensive to operate and keep maintained, Discord is a confusing mess and the upshot of all of this is every community needs community management and forum moderation. Which means that for my own small solo projects, I couldn't possibly have such infrastructure because such infrastructure requires a dedicated second person to maintain it, and until someone volunteers for that, it's not really feasible. Even for my larger projects you'd be surprised how slim of a skeleton crew we are getting by with, and we definitely don't have a whole spare maintainer to go manage this, especially as we are under attack from the slopocalypse ourselves.
The nature of open source community is that most communities start too small to need such a thing, grow incrementally until one day they are suddenly way too big and needed one yesterday, and then suddenly they are too small again when interest wanes even a little bit. Even as we need it more and more, building and maintaining community infrastructure remains a challenge.
Even so, having a dedicated place for users - not maintainers - to converse amongst themselves, be an actual community, and present feedback to the developers, is fast becoming a necessary component of a successful community and not a nice-to-have.
In Conclusion
As trying as it can be sometimes, we maintainers all do get something out of open source, and it is good to be honest with your users - and with yourself - exactly what you want to get out of it. In order to know whether the juice is worth the squeeze, we must know both what the juice is, and what the squeeze is.
Part of the metaphorical squeeze is a set of obligations, and those are the most poorly defined of all. We should try to be clear about what those are too. Both about exactly what we believe we are signing up for, and also, about how we are willing to let our users hold us to account for them. Codes of conduct are a start here, but only the absolute barest bare minimum; "do not harass your colleagues or your users" is not a standard of excellence to aspire to, it's just basic manners.
I can't tell you exactly what your obligations are, only try to gesture at my idea of the outlines of the fuzzy moral intuition we've all been implicitly sharing up until now.
Drawing this line is not just for the benefit of the users, either. Maintainers already feel pressure, we already feel obligations. We resent that feeling of obligation. While there are a diverse array of reasons for that resentment, one big one is that it's not clear, even to ourselves where the obligations end. Lashing out by saying "I promised nothing and I owe you nothing!" followed by some choice expletives feels cathartic, but it doesn't really solve the problem, because we clearly don't really believe that's where the line is, or we would have already stopped there. We wouldn't feel the need to say it.
It is going to be a very big collective endeavor to figure out exactly where that line is. The best time to have gotten started on that endeavor was 50 years ago.
But the second best time is today.
Acknowledgments
Thank you to my patrons who are supporting my writing on this blog. If you like what you've read here and you'd like to read more of it, or you'd like to support my various open-source endeavors, you can support my work as a sponsor!9
-
Somewhat to everyone's surprise, I, too, do things for money, like writing this post. Please remember to like and subscribe ↩
-
Whether it was originally yours, or developed by an employee who happened to be on staff at the time, or adopted by an employee who just started contributing to it a lot, in any of these scenarios a company can benefit from increased consistency and increased familiarity. ↩
-
If the rule is that they must forever endure the searing budgetary pain of gripping the white-hot potato that they unwittingly caught when they first made a good technical choice, this creates a perverse long-term incentive. ↩
-
I also find it darkly amusing that there is an explicit affordance here made for advertising, specifically, "Packages with code that can be used to display ads are fine. Packages that themselves display ads are not." This distinction rather gives the game away, that this is a website for carnies and not for marks, and that at some level we expect our users to deserve a lower level of respect than ourselves. But a full exploration of that is another blog post, or maybe a book, that I don't have time to write right now. ↩
-
If you want the turbocharged ultra-dramatic version of this problem, make it open source drivers for an optical prosthesis that lets the users see instead of an art app. That level of immediate physical dependency could be clarifying. It does also start to edge into an area where you could say that biomedical devices ought to be regulated differently, and that's not really a "software" problem but a "healthcare" problem and I'd mostly agree. Except for the fact that this is a very short distance away from breaking everyone's screen-reader with no notice or recourse. ↩
-
Did you believe I could write a blog post in 2026 which wasn't somehow about AI? I wish I could still believe that. ↩
-
It doesn't help that many of the most pro-AI voices are starting to have an, ahem, discernible political valence that is very unpopular among users. ↩
-
My apologies to MLK. ↩
-
If you read this whole post you can see that I sure need the help with all that. ↩
25 Sep 2026 12:50am GMT