31 Jul 2026
 Planet Mozilla
The Servo Blog: June in Servo: real world compat, media queries, SharedWorker, and more!
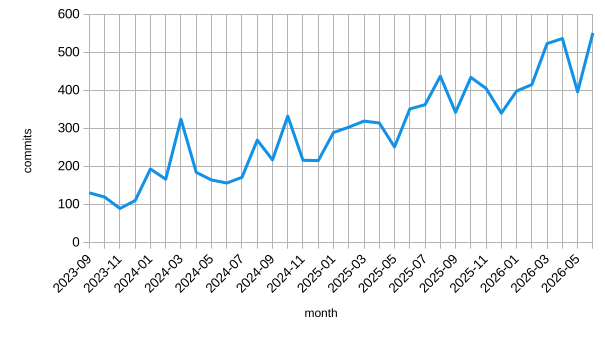
Servo 0.4.0 contains all of the changes we landed in June, which came out to yet another record 558 commits (April: 534, May: 391). For security fixes, see § Security.
We've shipped several new web platform features:
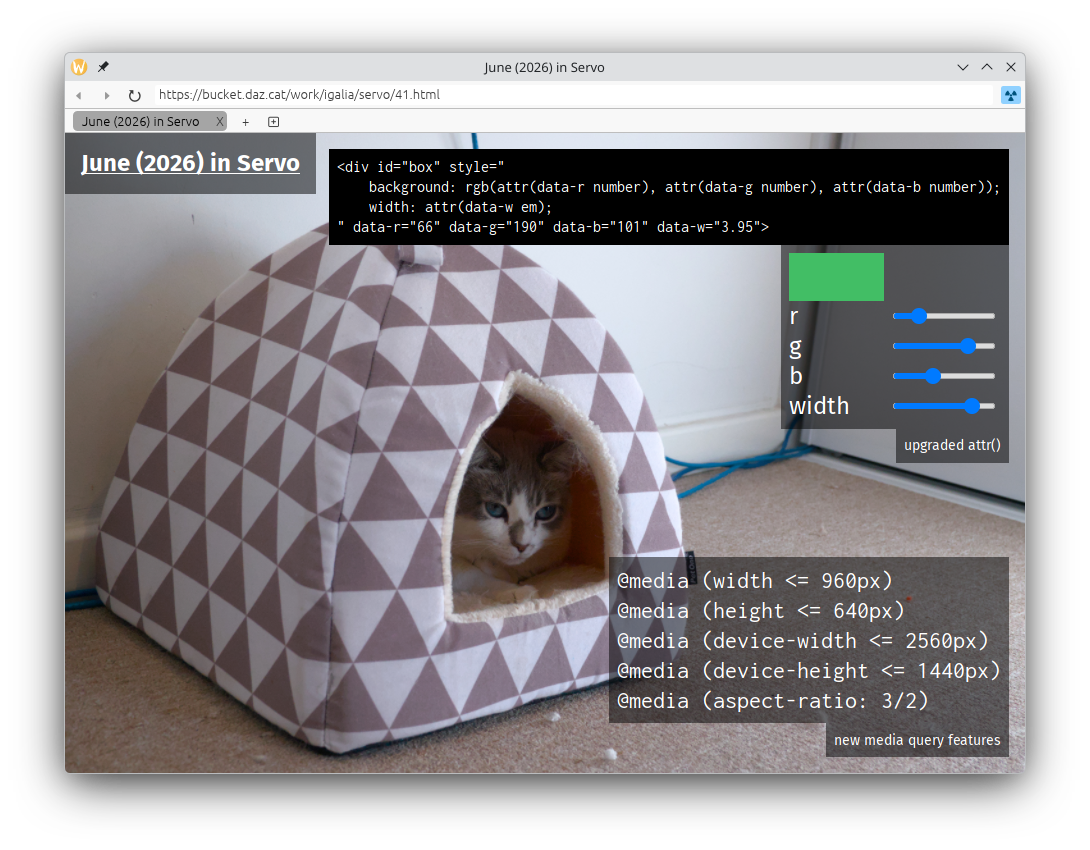
- 'attr()', in experimental mode (@Loirooriol, #45041)
- 'image(<color>)', 'closest-corner', and 'farthest-corner' in 'ellipse()' and 'circle()' (@Loirooriol, #45421)
- 'calc()' and other mathematical expressions can now be resolved later than parse time, e.g.
sign(1em - 32px)(@Loirooriol, #45421) - 'font-feature-settings' in '@font-face' (@simonwuelker, #45393)
- '@media (device-width)', '@media (device-height)', '@media (height)', '@media (aspect-ratio)', and their min- and max- variants (@jdm, @mrobinson, @nicoburns, @jschwe, #44978, #45707, #45490)
- '@media (orientation)' (@nicoburns, #45707)
- '@media (pointer)' and '@media (any-pointer)' (@nicoburns, #45681)
- '@media (hover)' and '@media (any-hover)' (@nicoburns, #45681)
Plus a bunch of new DOM APIs:
- SharedWorker (@Taym95, #45786)
- console.dir() (@Taym95, #45109)
- customElementRegistry on Document and ShadowRoot (@shubhamg13, #45872)
- initialize() on CustomElementRegistry (@shubhamg13, @yezhizhen, #45903)
- new CustomElementRegistry() (@shubhamg13, #45791, #45550)
- textStream() on Request, Response, and Blob (@yezhizhen, #45864, #45861)
- setPointerCapture(), releasePointerCapture(), hasPointerCapture() on Element (@webbeef, #45048)
- ontouchstart, ontouchend, ontouchmove, ontouchcancel on Element (@stevennovaryo, #45049)
- crypto.subtle.digest() for KT128 and KT256 (@kkoyung, #45699)
- crypto.subtle.getPublicKey() for ML-KEM and ML-DSA (@kkoyung, #45252)
This is another big update, so here's an outline:
You can help!
Servo is steadily becoming a bigger and busier project every month, and by June 2026, we've been reading through over four times the commits as we did when we started in September 2023.
This is hard work, particularly since there are things we need to know that are often difficult to answer just by reading the changes:
-
Who does the change affect, if anyone? Does it affect users, Servo developers, embedders, or some other group?
-
What observable difference does the change make, if any?
-
Does the feature require any preferences to be enabled, or is it enabled for everyone by default?
-
Are any real-world websites affected by the change?
-
What issue or broader project is the change related to? This question is answered by
Fixes: #xxxxxorPart of: #xxxxxin the PR description.
Thanks to an initiative by @jdm, it's now easier than ever for you to help us answer those questions, using the Servo Highfive bot! If you're working on a pull request that you think might be interesting for the next monthly update, even if you're not 100% sure, tell us about it by following the steps below:
-
You add the monthly update label to your pull request, or comment
@servo-highfive monthly update -
Highfive posts a comment asking you some questions
-
You answer those questions in a comment containing
@servo-highfive monthly update answer
Security
Servo's JS runtime, SpiderMonkey 140.10.1, had several security bugs that have been fixed in Servo 0.4.0 with the update to SpiderMonkey 140.11.0 (@jschwe, #45584). For more details, see CVE-2026-8388, CVE-2026-8391, CVE-2026-8974, CVE-2026-8975, and MFSA 2026-48.
Several more security bugs in Servo's JS runtime have been fixed in Servo 0.4.0 with the update to SpiderMonkey 140.12.0 (@jschwe, #45766). The exact CVEs that apply to us are not yet known, but for more details, see MFSA 2026-58.
RSA operations in SubtleCrypto now do modular exponentiation in constant time (@kkoyung, #45631). Please note that our RSA implementation is currently vulnerable to the Marvin Attack - for more details, see RUSTSEC-2023-0071.
ML-DSA operations in SubtleCrypto now do the Decompose step in constant time, fixing RUSTSEC-2025-0144 (@kkoyung, #45294).
We've fixed an HTML injection bug (XSS) in file:/// directory listings, which affected file names containing </script> (@sahvx655-wq, #45510).
Real world compat
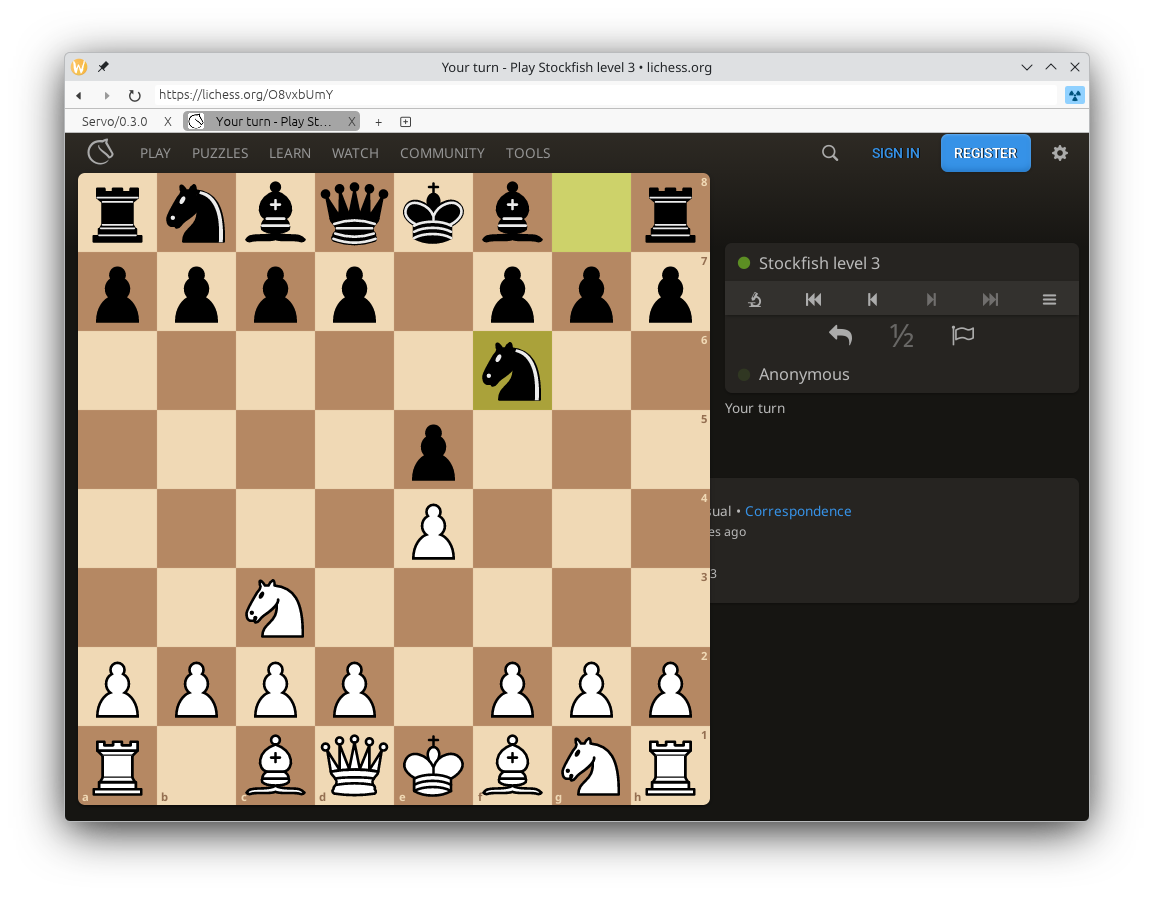
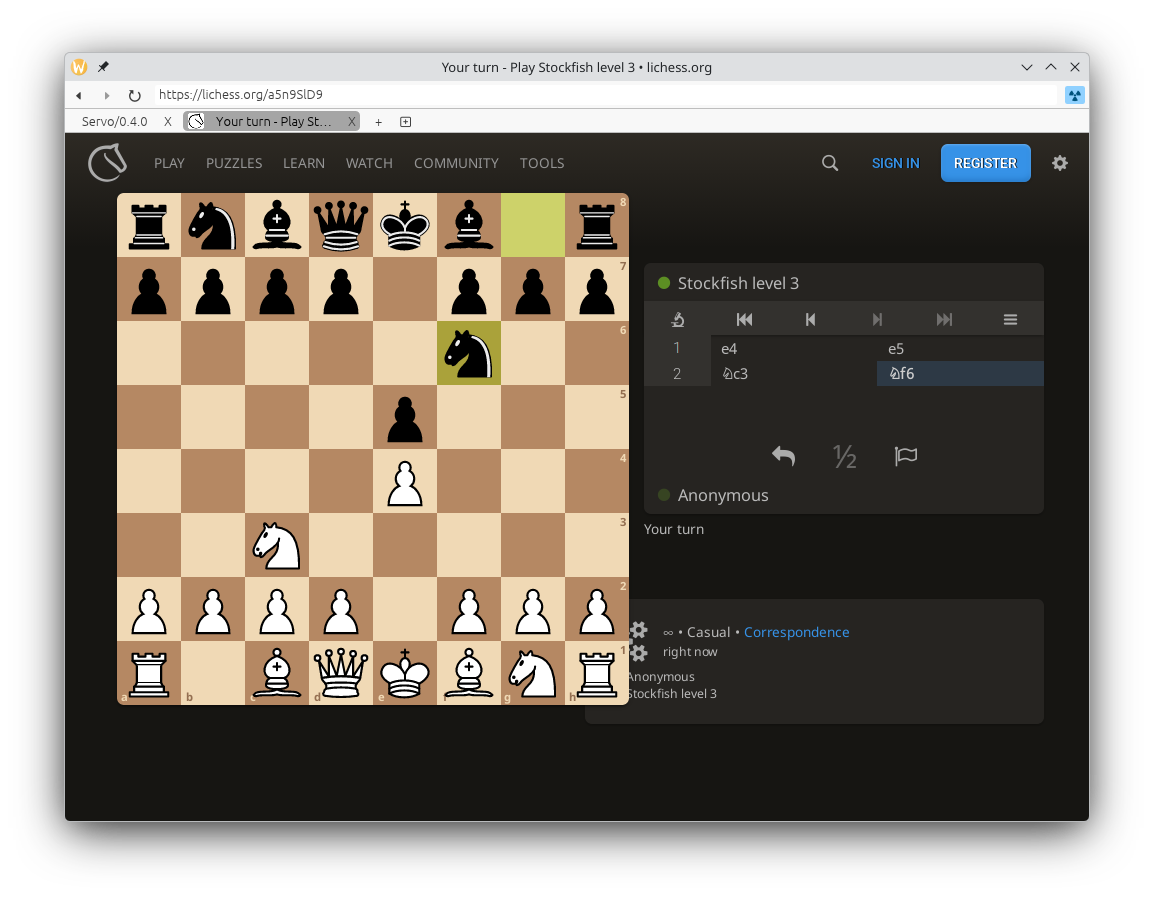
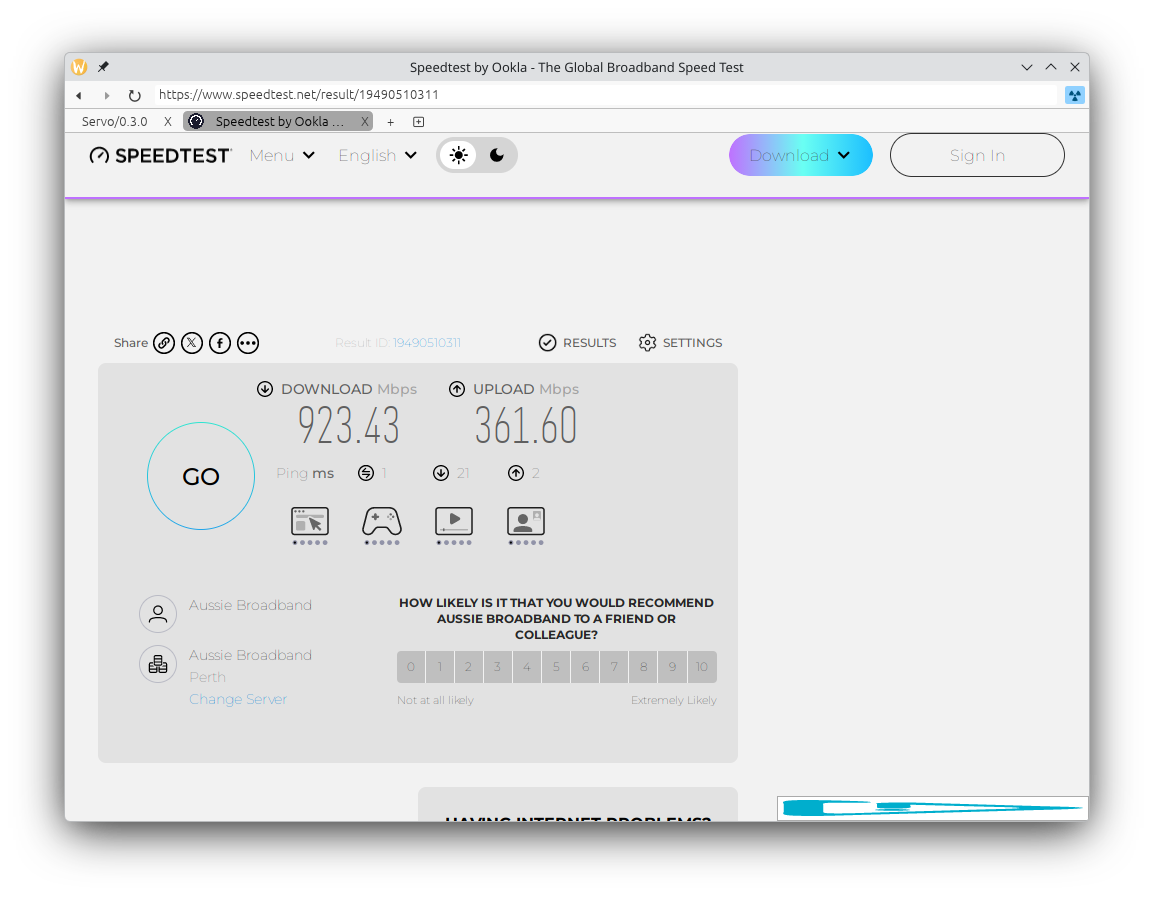
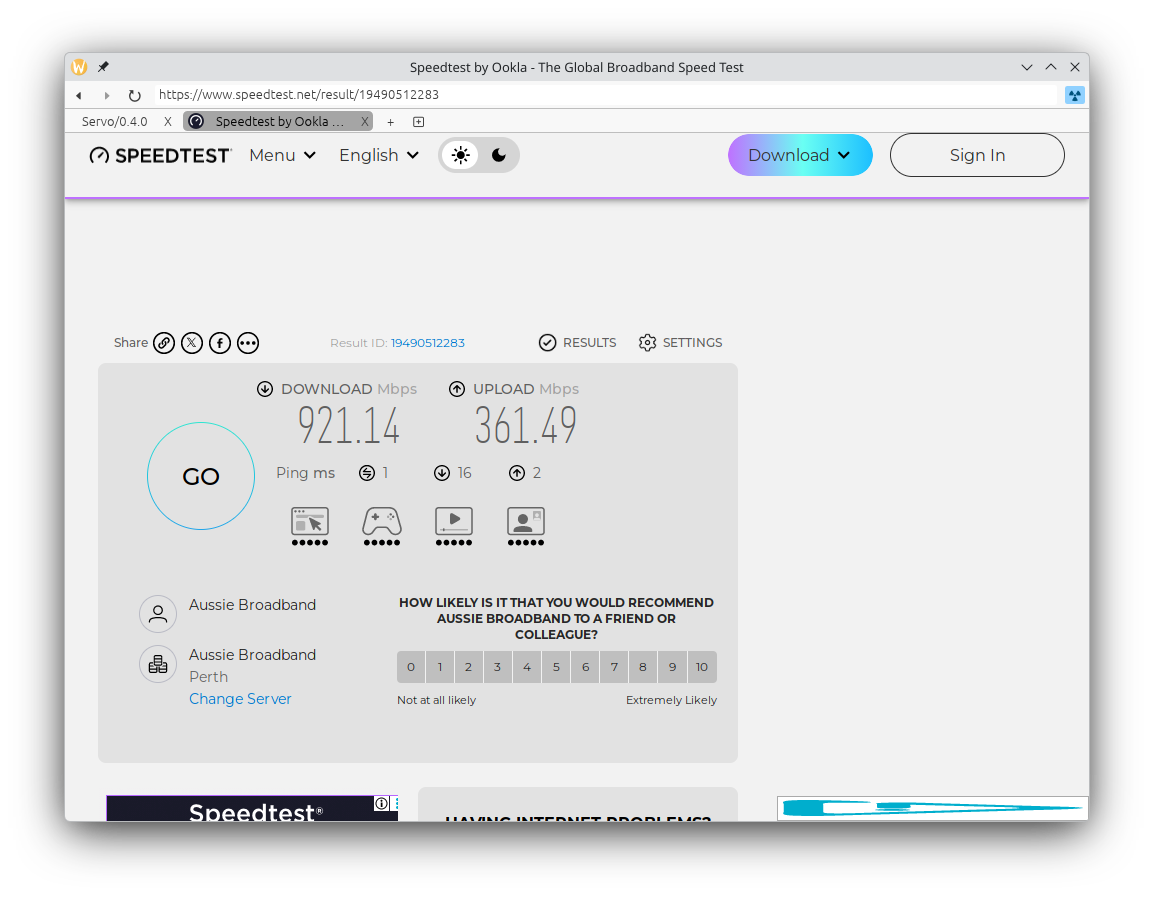
Layout correctness has significantly improved on lichess.org, and many websites have become a lot more readable thanks to our improved handling of variable fonts (@simonwuelker, #45768), including Zulip (servo.zulipchat.com) and Speedtest (speedtest.net).
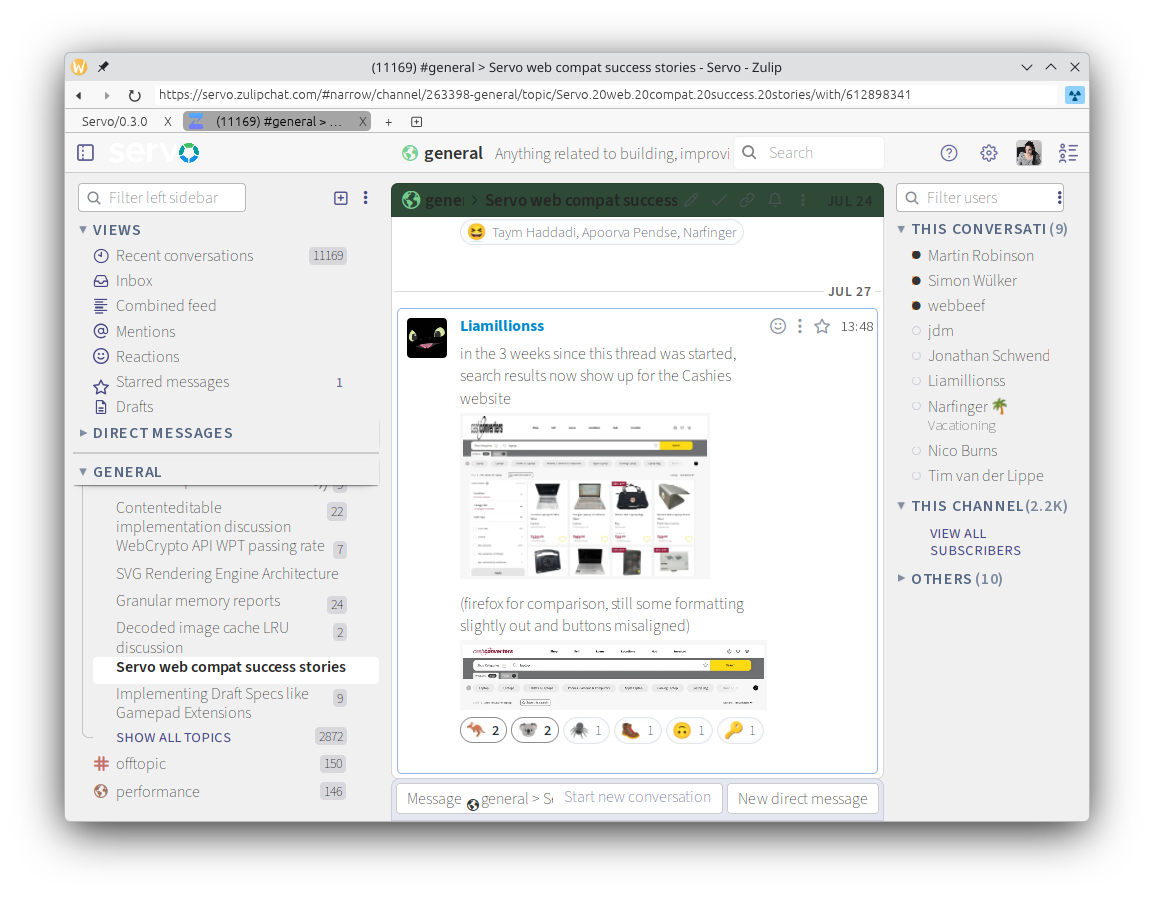
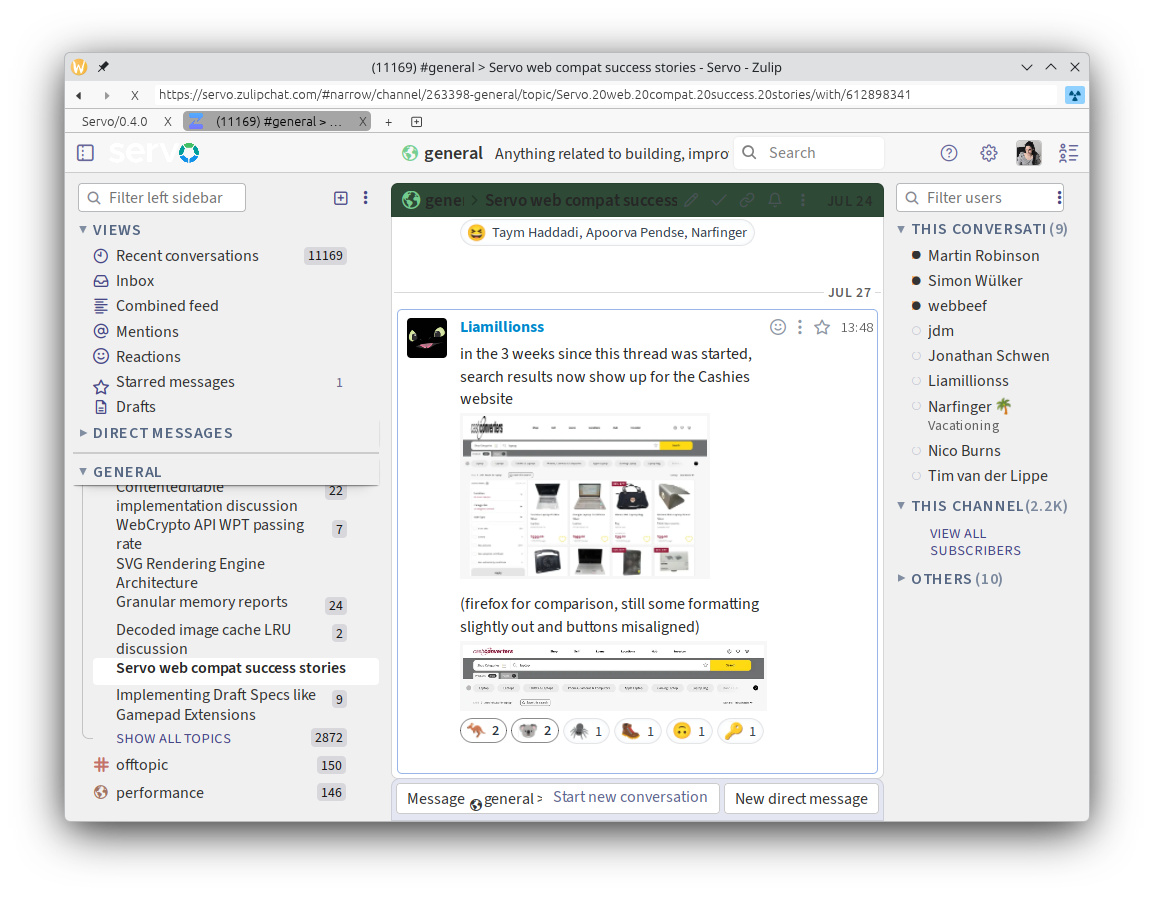
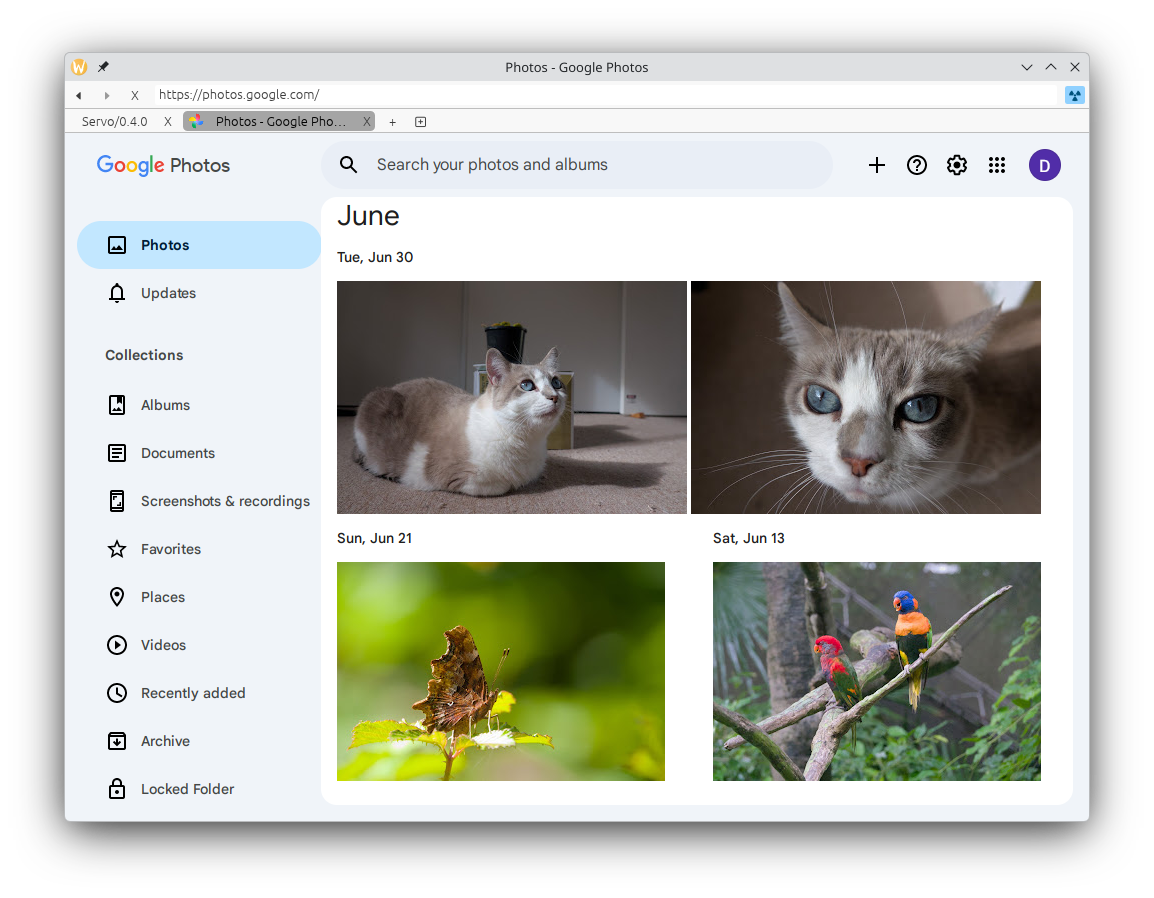
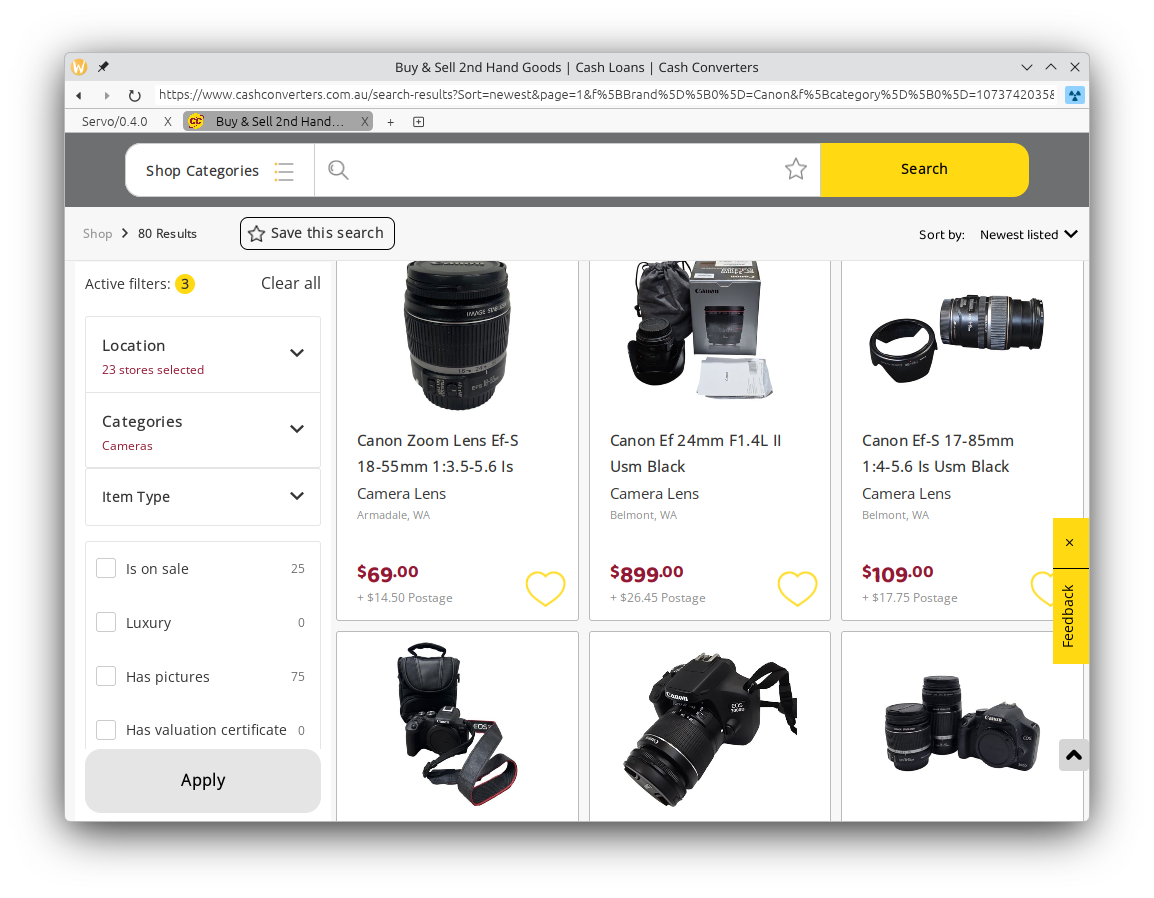
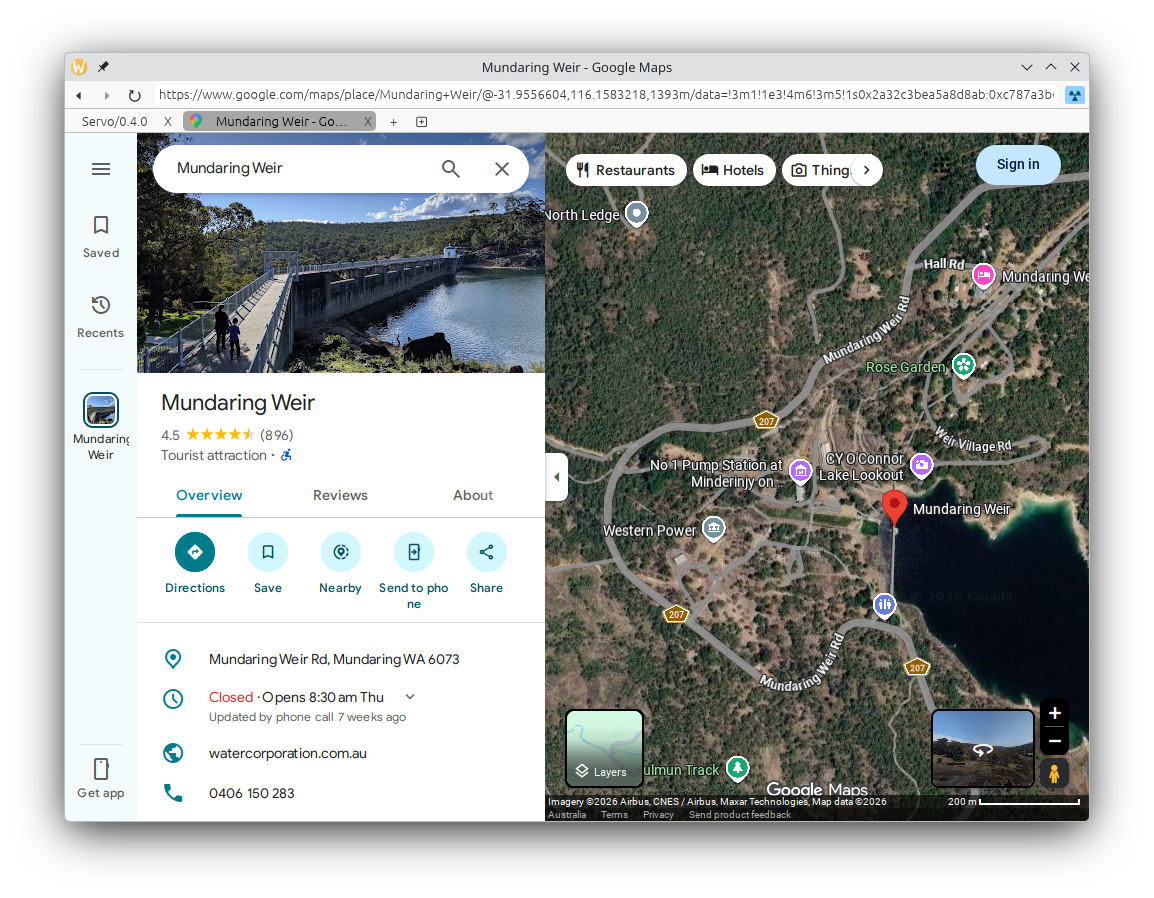
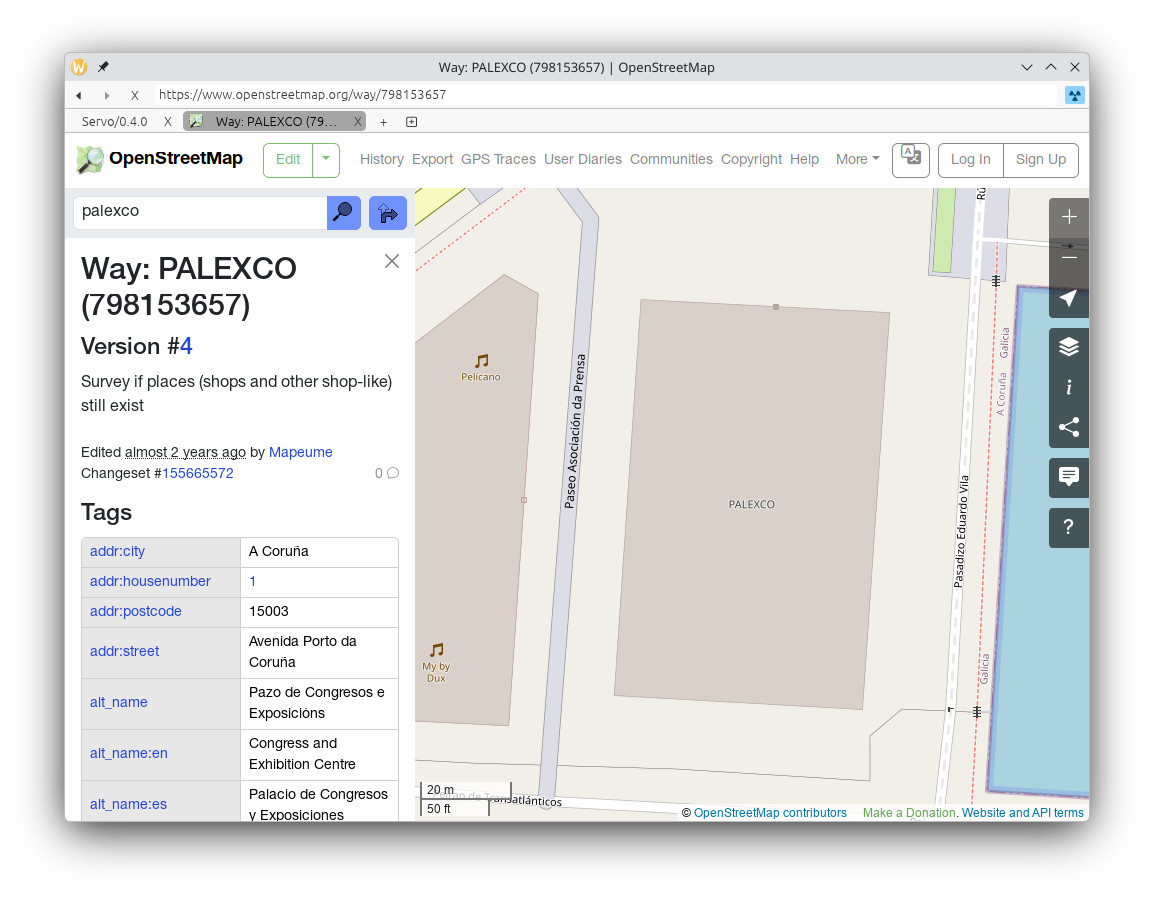
Many websites worked in Servo even before version 0.4.0, including Google Photos (photos.google.com) and Cash Converters (cashconverters.com.au), and continue to work in version 0.4.0. Other websites, like Google Maps (maps.google.com) and OpenStreetMap (www.openstreetmap.org), render well but have some issues with interactivity.
We're interested to hear how well your favourite websites run in Servo! Report successes in this Zulip thread, and failures in our GitHub issues.
Work in progress
We're implementing the more powerful version of 'attr()' that can be used anywhere, not just in 'content', under --pref layout_css_attr_enabled (@Loirooriol, #45041, #45421, #45495, #45752).
WebGPU support has improved, under --pref dom_webgpu_enabled:
- implemented copyExternalImageToTexture() on GPUQueue (@sagudev, #45646)
- implemented createQuerySet() on GPUDevice and resolveQuerySet() on GPUCommandEncoder (@sagudev, #45644)
- implemented pushDebugGroup(), popDebugGroup(), and insertDebugMarker() on GPUCommandEncoder, GPUComputePassEncoder, and GPURenderPassEncoder (@jschwe, #45489)
- more conformant GPUTexture (@sagudev, #45300)
- more conformant requestAdapter() on GPU (@sagudev, #45424)
- more conformant secure context enforcement (@sagudev, #45279)
All of the features above are enabled in servoshell's experimental mode.
We've made more progress towards accessibility support, under --pref accessibility_enabled (@alice, @delan, #45555, #45554, #44949).
We've started implementing visible and interactive text selection (@mrobinson, @SimonSapin, #46107), one of the most long-awaited features of any web browser. Stay tuned!
We've also started working on Web Animations, under --pref dom_web_animations_enabled (@simonwuelker, #45522, #45983), as well as webkitRelativePath on File, under --pref dom_entries_api_enabled (@yezhizhen, #45666).
Rust doesn't have a stable ABI, so it has generally not been possible to embed Servo in another application without building Servo from source. To make it possible, we've started designing a wrapper C API that will let you consume Servo as a prebuilt shared library using the stable and ubiquitous C ABI (@mukilan, #44984). Eventually the idea is that we'll create a wrapper Rust API around that wrapper C API, so you can have both the ergonomics of Rust and the build simplicity of C.
Embedding API
New in the Servo API:
Breaking changes:
WebView::send_errorhas been removed (@mukilan, #45502) - this method was always meant to be internal, and has become unused after we introduced the new WebView- and WebViewDelegate-based API
We've improved the docs for WebView, WebViewDelegate, JSValue, AlertDialog, AllowOrDenyRequest, AuthenticationResponse, BluetoothDeviceDescription, ConfirmDialog, ConsoleLogLevel, CreateNewWebViewRequest, EmbedderControl, EmbedderControlResponse, FilePicker, Image, JavaScriptErrorInfo, NavigationRequest, PermissionRequest, PixelFormat, PromptDialog, ProtocolHandlerRegistration, ProtocolHandlerUpdateRegistration, Scroll, SelectElement, SelectElementRequest, and WebViewVector (@mukilan, #45282, #45467).
For users and developers
In servoshell:
-
the Android version now requires Android 13+ (@jschwe, #46104)
-
the desktop version now lets you drag and drop files to open them (@simonwuelker, #45454)
-
the desktop version now lets the tab bar scroll horizontally if you have too many tabs open, but from one tab hoarder to another, maybe you should reconsider having so many tabs open (@Nylme, #44884)
-
the desktop version enters fullscreen on the monitor containing the window, even if you've moved it to a different monitor (@rhit-kapilaar, #45556)
-
the desktop UI is more performant, resizes more smoothly, and no longer gets stuck in hovered states (@mrobinson, #45289, #45456, #45290)
-
<select multiple> should now be interactable on all desktop platforms (@alexcat3, #45419)
-
localhost:<port>now implieshttp://in the location bar and on the command line, rather than treatinglocalhost:as an unsupported URL scheme (@SteveSharonSam, #45729, #45832)
When using the Firefox DevTools:
-
in the Console tab, uncaught exceptions are reported correctly (@jdm, #45549)
-
in the Console and Debugger tabs, you can now inspect the elements of nested arrays and the entries of Map objects (@atbrakhi, #45435, #45514, #45767)
-
in the Debugger tab, the Scopes panel now shows any '(uninitialized)' variables, the value of
this, and the global scope (@atbrakhi, @eerii, #45824, #45517)
We've fixed some build issues on riscv32, riscv64, and arm64 (@fxzjshm, @saschanaz, #45285, #45731), and modernised servoshell for Android to use Compose UI and Kotlin (@veyndan, #45923, #45932, #45941, #45982, #45985, #46015, #46035, #46037, #46046, #46053, #46061, #46071, #45641, #45643, #45650, #45665, #45671, #45676, #45679, #45683, #45712, #45713, #45734, #45738).
For developers of Servo itself:
-
mach try --helpnow lists all of the kinds of try jobs you can run (@shubhamg13, #45607) -
mach test-wpt --update-expectationslets you run Web Platform Tests and update expectations in a single command (@TimvdLippe, #45521), rather than having to runmach test-wpt --log-raw <path>followed bymach update-wpt <path>
More on the web platform
To allow for more performant scrolling, 'wheel' events are no longer .cancelable unless there are one or more non-passive event listeners (@kunalmohan, #45667). Note that like in Firefox, 'wheel' events are passive by default.
'dotted', 'dashed', and 'wavy' text decorations are now continuous across element boundaries (@mrobinson, #45726).
We've improved the conformance of <dialog> (@skyz1, @mrobinson, #45825, #45761), <iframe sandbox> (@cychronex-labs, #45880), <input minlength> and <input maxlength> (@skyz1, #45705), CSS gradients (@mrobinson, #43945), 'font-style' and 'unicode-range' in '@font-face' (@Loirooriol, #45821), FontFaceSet (@mrobinson, #45390, #45382), HTMLInputElement (@steigeo, #45416), IntersectionObserver (@jdm, #45655, #45659, #45680), new Response() (@yezhizhen, #45953), URL.createObjectURL() and URL.revokeObjectURL() (@yezhizhen, #45182, #45417), and ECDSA and Ed25519 in SubtleCrypto (@kkoyung, #45833, #46017).
We've fixed bugs related to <input hidden> (@mrobinson, #45750), 'animation-delay' (@yezhizhen, #45013), 'clip-path' (@Loirooriol, #45468, #45373), 'tab-size' (@SimonSapin, @mrobinson, #45309), 'width' and 'height' (@RichardTjokroutomo, #44627), 'box-shadow: inset' (@Loirooriol, #45620), 'animationiteration' events (@Loirooriol, #45990), 'click' events (@mrobinson, #45751), 'load' events (@jdm, #45883), 'error' events in Worker global scopes (@Gae24, #45829), and document.getElementById() (@mrobinson, #45433).
Garbage collection safety
We use a RefCell-based mechanism to store many of our DOM types in other DOM types, enforcing Rust's "aliasing xor mutability" rule at runtime by panicking if the rule is violated. But when garbage collection happens, we need to borrow() each DomRefCell to trace the references, and this is the source of many panic bugs. To fix that whole class of bugs, we initially created CanGc, a marker type that would annotate the code paths where GC can occur, in conjunction with custom static analysis (@jdm, #33140).
With the Rust type system we can do even better, if we flip that around and require any borrow_mut() call to prove that GC can not occur by passing a NoGC marker value. We can then require that a &NoGC must be borrowed from a &JSContext (which blocks GC) and not a &mut JSContext (which allows GC), taking advantage of how Rust references work without needing any custom static analysis.
We have a large codebase that needs to be migrated in parts, so for now we've created the new method safe_borrow_mut() (@sagudev, #46050). We also need to update all of our script-related code to borrow our safe JSContext wrapper, rather than creating an owned JSContext on the spot.
This continues our long-running effort to use the Rust type system to make Servo's integration with SpiderMonkey safer and more reliable (@Gae24, @Keerti707, @Narfinger, @TimvdLippe, @sagudev, @guptapiyush16, @ivomurrell, @kunalmohan, @skyz1, #45230, #45436, #45503, #45617, #45711, #45797, #45800, #45858, #45884, #45937, #45902, #45968, #45977, #45991, #46003, #46005, #46084, #45548, #45552, #45590, #45909, #45912, #45943, #46089, #46117, #46114, #45320, #45324, #45328, #45340, #45381, #45385, #45410, #45392, #45409, #45604, #45616, #45618, #45627, #45636, #45662, #45663, #45675, #45674, #45677, #45684, #45735, #45807, #45810, #45816, #45818, #45828, #45838, #45836, #45837, #45840, #45841, #45857, #45859, #45862, #45875, #45887, #45931, #45964, #45935, #45987, #45988, #46001, #46040, #46051, #46057, #46106, #46125, #45678, #46002, #45845, #45645, #45673, #45259, #45817, #45822, #45876, #45877, #45891).
Performance and stability
NoGC was designed to prevent dynamic borrow failures, but it also enables some performance optimisations! If we can prove that garbage collection is impossible in some part of Servo, we can often avoid rooting JavaScript objects when interacting with them within that region of code. This has allowed us to reduce overheads by over 1% in the layout process and in HTMLCollection (@Narfinger, #46092, #45582).
Our memory usage has improved, with BoxFragment now 17% smaller (288 → 240 bytes on amd64) and ShapeCacheEntry now smaller too (@SimonSapin, @mrobinson, @simonwuelker, #45183, #45496).
We've fixed some nasty memory leaks when reloading and in 2D canvases (@Taym95, @sagudev, @jschwe, #45455, #45261, #45414).
Speaking of which, 2D canvases now use up to 23% less power (@yezhizhen, #45301), and we now avoid rasterising the same SVG more than once (@Narfinger, @jschwe, #44805).
Servo now decodes all images asynchronously and fills image caches asynchronously, leaving script threads (web content processes) more time for other work (@Narfinger, #45542, #44483). On top of that, we've improved incremental layout (@mrobinson, @Loirooriol, #45411) and reduced reflows in IntersectionObserver (@jschwe, #45986).
We've started working on incremental updates for the stacking context tree, and as a side effect, we've made some layout-bound microbenchmarks up to 10% faster (@mrobinson, @Loirooriol, #45208).
We've also reduced allocations, copies, GC rooting steps, and other operations in many parts of Servo (@Narfinger, @SimonSapin, @mrobinson, @Loirooriol, #45506, #45969, #45940, #45760, #46090, #45335, #45413, #45511).
For several months, Frédéric (@fred-wang) has been fuzzing for Servo bugs, and thanks to his work we've fixed sixteen (16) crash bugs in June, affecting <iframe>, <slot>, <link onerror>, 'animation', 'clip-path', 'content', 'rotate', 'transition', 'transform-style', 'display: contents', 'overflow: clip', CSSKeyframesRule, FontFace, stop() on Window, document.elementFromPoint(), and the DOM tree (@mrobinson, @Loirooriol, @fred-wang, #46031, #46027, #46054, #46058, #46016, #46028, #46033, #45287, #45951, #45634, #45629, #46110, #46094, #45799, #45611, #45682, #45788, #45612, #45834).
We've also fixed crash bugs related to IPC failures, HTMLInputElement, Range, the DevTools Debugger tab, and when servoshell is built with --features native-bluetooth (@jschwe, @Taym95, @mrobinson, @atbrakhi, @mukilan, #45311, #45619, #45765, #45513, #45702).
New contributors
A special thanks to the following people for landing their first patch in Servo:
- Deepam Goyal (@Deepam02, #44836)
- Mark (@Mark-Boger, #45486)
- Mr SheerLuck (@MrSheerluck, #45557)
- Psychpsyo (Cameron) (@Psychpsyo, #45494)
- TusharSariya (@TusharSariya, #43663)
- Adam Sharif (@adamsharifc, #45551)
- Akash Ravikumar (@ak4shravikumar, #45736)
- Sean Cunneen (@alexcat3, #45419)
- Abdul Wahab Melethil Shibu (@cychronex-labs, #45880)
- darkdragon-001 (@darkdragon-001, #45267)
- Frédéric Wang Nélar (@fred-wang, #45834)
- fxzjshm (@fxzjshm, #45285)
- Piyush Gupta (@guptapiyush16, #45845)
- Ivo Murrell (@ivomurrell, #45645)
- rhit-kapilaar (@rhit-kapilaar, #45556)
- sahvx655-wq (@sahvx655-wq, #45510)
- Kagami Sascha Rosylight (@saschanaz, #45731)
- shangguanmachine-dot (@shangguanmachine-dot, #45310)
- Glenn Skrzypczak (@skyz1, #45471)
- Oskar Steiger (@steigeo, #45416)
- Veyndan Stuart (@veyndan, #45326)
Interested in helping build a web browser? Take a look at our curated list of issues that are good for new contributors!
Donations
Thanks again for your generous support! We are now receiving 7681 USD/month (+0.2% from May) in recurring donations. This helps us cover the cost of our speedy CI and benchmarking servers, one of our latest Outreachy interns, and funding maintainer work that helps more people contribute to Servo.
Servo is also on thanks.dev, and already 35 GitHub users (same as May) that depend on Servo are sponsoring us there. If you use Servo libraries like url, html5ever, selectors, or cssparser, signing up for thanks.dev could be a good way for you (or your employer) to give back to the community.
We now have sponsorship tiers that allow you or your organisation to donate to the Servo project with public acknowlegement of your support. If you're interested in this kind of sponsorship, please contact us at join@servo.org.
Use of donations is decided transparently via the Technical Steering Committee's public funding request process, and active proposals are tracked in servo/project#187. For more details, head to our Sponsorship page.
31 Jul 2026 12:00am GMT
30 Jul 2026
Planet Mozilla
Thunderbird Blog: Mobile Progress Report: July 2026

Thunderbird Mobile is moving forward with large steps on both platforms we support. On iOS, we're working on the very foundation of a new app-our first built from scratch-and continuing to make progress in bringing the Thunderbird for iOS app to the App Store. For Android, it's a matter of updating what we have in place to make it easier to use, more reliable, and more efficient. Both platforms are rushing forward to deliver exactly what our users expect from us.
iOS
Starting off with iOS, we've focused on a few vital components. This includes the compose screen, account drawer, and OAuth, which allows users to add their accounts using the sign in page of their email provider. For the compose view, our HTML rich text editor is coming along nicely. We forked a WYSIWYG repository, Infomaniak's "swift-rich-html-editor," to create a rich text view for both composing and editing. We also added view headers, fixed a bug where we weren't applying links properly to the DOM, and began porting a proof of concept over to the main app code. This will eventually become the compose view for the final app. We also started the technical design phase for the new account drawer design.
Android
The Android team has been busy looking into drastic changes to the app to make it more user-friendly, faster, and more reliable. We're directly targeting feedback we've received. We're also continuing work on developer-friendly features to make contributing to the project easier and faster.
Database Rewrite
We've started our large database refactor with a tentative selection of Room. We chose this for a number of reasons, including performance, easier writing of data entities, and the ease of introduction for new engineers. Room is common in Android development, which means we can more quickly onboard new contributors with it. We'll have an RFC out by the end of August detailing how we'll implement the new database.
So why are we rewriting the database? It's the source of a number of issues with the app. Everything runs through it, from fetching locally-stored drafts, triggering notifications for new messages, syncing, reliability, and even power consumption. By updating the database, we make it possible to drastically improve everything in the app it touches, which is to say, everything.
Feature Flags
Developers will also be happy to know we're improving the feature flag process. We've completed an RFC for a new schema and began work on the technical documentation. We're looking to develop a local feature flag library that will use OpenFeature and eventually enable remote feature flag management, though that's not our short term goal. For now, we want to make it easier to create and modify feature flags across build types, without needing to edit so many files to do so. In the future, however, this will make it easier for us to roll out releases, updated features, and even rolling back features that may have issues without having to wait for the app release and approval cycle. It allows us to make a more reliable app with faster feature implementations.
Notifications
Finally, we've heard that our users do not like how we handle notifications. We've been investigating reported bugs and working to find a path forward that allows us to use previous work to improve notifications.
We're also looking into a key complaint: setting up notifications and "push" (IMAP Idle) notifications is just too difficult. We don't make it easy enough for users to set up their notifications and ensure they get email notifications when their email server reports updates. Users have made it clear: that has to change.
We're currently discussing options with design to consolidate some settings, bring other settings to the forefront, and will be working next month to activate "push" notifications by default for new accounts that support it.
We know notifications are a cause of headaches, even for those who understand how to use the app's existing features, so we want to address them as quickly as possible. We'll also focus on identifying issues and helping our users report problems with notifications in detail with user-enabled and anonymous logging that can help us see why a notification did not show for a new email if they want to help us work through it.
Bolt Design Library
Android has also begun the work of moving our Bolt design library out of the app to serve as a standalone library. Currently, we've pulled out the foundation layer for mobile that includes fonts, colors, spacing, and other repeated values. Eventually we'll use WebASM to render the design system and allow contributions directly to the design system, without needing to touch the Android app, potentially allowing it to be platform independent.
Community
Two crashes were caught in the beta, including a crash related to relative date formats and another to webviews. We want to thank our amazing community of beta testers who helped us catch these before they made it to a full release. Our community contributors have also directly fixed bugs, like issues scrolling horizontally in message views, fixing a button that couldn't be seen properly in dark mode, fixing an issue with the wrong number of messages in confirmation dialogs, and updates to our historical changelog data to be in a more readable and usable format. We can't thank our community of testers, contributors, and users enough for the work they put in helping us make Thunderbird a better email client.
We couldn't do what we do without you, and, as always, thank you for being part of the Thunderbird community. Here's to another month making the best email client we can, together!
- Danielle G. (she/her), Senior Android Engineer
The post Mobile Progress Report: July 2026 appeared first on The Thunderbird Blog.
30 Jul 2026 7:00pm GMT
29 Jul 2026
Planet Mozilla
About:Community: Community Roundup: Project Nova, Tab Groups & more
Firefox keeps evolving, and the community continues to play a big part in shaping what's next.
In this edition, you can get an early look at Project Nova through our latest foxfooding opportunity, explore Tab Groups on Android, join the conversation on Mozilla's latest browser choice research, and meet an Outreachy contributor whose journey reminds us why open source thrives through collaboration.
Get ready to dive in!
Hot from the oven: Join Project Nova foxfooding
We teased it in the last edition, and now it's here. Project Nova has finally arrived on Firefox Nightly, and you're invited to be an early tester! Get a look at Firefox's refreshed design as we put the finishing touches on the experience ahead of its broader release later this year. If you're curious about what's coming next, this is your chance to try it out, share your feedback, and help shape the final product.
Monthly Community Call today!
Want to ask questions directly to the people working on Firefox? Join us for today's Monthly Community Call, where we'll discuss Project Nova and Firefox performance feature with members of the teams working on these projects. Join the call today, July 29, 2026, at 5:00 PM UTC, and bring your questions!
Tab groups arrives on Android
You've been calling out for tab group functionality on Firefox mobile and now Tab Groups have officially arrived on Firefox for Android! Tab Groups make it easier to organize related tabs into color-coded groups for work, travel, shopping, research, or whatever you're browsing. Give it a try, and if you have ideas for how it could be even better, let us know on Mozilla Connect.
From the Reddit Community
Mozilla recently shared new independent research examining how browser choice is shaped by the design of operating systems. The report explores the obstacles users can encounter when downloading, setting, or continuing to use their preferred browser, and argues that people should be able to choose their browser without unnecessary friction. Read the report, join the discussion, and share your perspective!
And of course, thanks to you for choosing Firefox!
Community spotlight
Every contributor starts somewhere. In a recent blog post, Ananya Shree Sharma reflects on her journey through the Outreachy internship with Firefox. From navigating a large open source codebase for the first time to collaborating with mentors, learning new skills, and shipping meaningful improvements. Her story is a reminder that open source is as much about learning, mentorship, and community as it is about writing code. If you've ever wondered what it feels like to contribute to Firefox, Ananya's reflections offer an inspiring look at the experience and the people who make it possible.
P.S.
Enjoyed these updates? Subscribe to the Mozilla Community Newsletter and get the latest updates delivered straight to your inbox.
29 Jul 2026 9:04am GMT