22 Jul 2026
 planet.freedesktop.org
Peter Hutterer: libei and graphics tablets stylus support
While you (yes, you! no, not you, the one behind you) have been sweltering in the heatwaves of the northern hemispheres (Assisted-by: AI), I've been busy adding graphics tablet support to libei. This is scheduled for the soon to be released libei 1.7.0.
The initial work was done by Jason Gerecke and Josh Dickens from Wacom, I've been extending, polishing and testing it for the last few weeks.
Also, upfront: this only covers the stylus part of a tablet, we do not yet have an implementation for the "pad" part (the buttons, dials, rings, strips).
libei is, of course, the library for Emulated Input, a good-enough transport layer for sending logical input events between processes. We're already using libei as part of the XDG Portal Remote Desktop and Input Capture portals where we've been busy hurtling key and pointer events between the participating parties (and soon gesture events and text).
In the next release of libei, we will now also have "ei stylus" capabilities, i.e. the ability to send tablet stylus events. Getting pointer, keyboard and touch events supported was a long undertaking, everything was new and shiny and needed to be added everywhere in the stack. Now that all this is in place, scuffed and scratched, adding tablet events will be quite simple.
The ei stylus interface
Here's a short outline of how libei handles tablet events because it is, of course, different to how libinput handles them. Logical events are much nicer after all than physical hardware events.
First: we have a new interface: "ei_stylus". An EIS implementation (e.g. your compositor) may provide you, the libei client, with a device that supports this interface and one or more associated regions (typically representing the available screen areas). Typically this will be a separate device to the pointer devices or the keyboard devices but it's not a requirement. The ei_stylus interface comes with a bunch of capabilities you'd expect from a stylus (tilt, pressure, distance, ...) that you can selectively enable to emulate the stylus you want to. So basically, EIS will say "here's a stylus device, I support pressure, tilt, rotation, ..." and then the libei client says "This stylus should have pressure and tilt but nothing else". And then you do the normal thing: send proximity events, send tip down/up events, send data for the various capabilities you've enabled.
Happily for the EIS implementation, libei forces the client to take the guesswork out of everything: if you select the pressure capability, you must send a pressure value when coming into proximity. Where libei is used to forward data from a physical stylus (e.g. via some remoting protocol) it is up to the client to deal with firmware bugs that e.g. won't send data until a few frames in.
Note that there is no "tablet" anywhere. The tablet is represented by the region that the device may interact with. So in some ways every tablet is an on-screen tablet (which makes sense since we have logical events).
Multiple styli
The only quirky thing is how to request multiple styli[1]: libei 1.5.0 has added a "request device" request that allows a client to say "hey, EIS, I want a new device with capabilities pointer, keyboard, ...". And, if you've been a nice client, minding your own business, the EIS implementation may just create such a device for you.
So for the case of multiple styli: if the default stylus (if any) isn't good enough, you can now tell EIS that you want a(nother) device with stylus capability, configure the stylus capabilities once the device shows up and voila, you now have a normal pen, an art pen and maybe even an airbrush represented as logical device in libei. And since they're all separate devices in the protocol, they can be individually tracked and used, much like libinput tracks individual styli.
[1] For the "lots" of users that actually use multiple styli...
22 Jul 2026 4:46am GMT
Peter Hutterer: libei and gesture events
/me gestures vaguely at everything
Oh, hey, this works now? Great!
libei 1.7.0 (to be released soon) comes with a new interface: "ei_gestures" which, creatively, will allow for gestures to be sent between a libei client and an EIS implementation (typically: a Wayland compositor).
I'm not going to go too deeply into how pinch, swipe and hold gestures work, suffice to say we've had those in libinput (for touchpads) for years now so compositors and toolkits should already support those. And since libei and libinput have vaguely equivalent API layers integrating gestures for libei devices in compositors should be fairly straightforward.
The plumbing layers in the portals exist already too, so adding gestures to libei means that - once the compositors support it - we can have gestures support in remote desktop and input capture implementations without needing to update anything else. Hooray! Join in with me. Hooray! Louder! HOORAY!
For testing I had a (vibe-coded and thus immediately abandoned once testing was complete) gesturemouse utility which translates input events from a mouse into gesture events (depending which button is down). But don't let my lack of be a limit to your imagination, I'm sure you can come up with good use-cases for this.
22 Jul 2026 4:22am GMT
Peter Hutterer: libei and keysym/text events
If you've been paying attention (and I know you have, because it'd be embarrassing for you if you didn't) you'd have noticed that libei 1.6 (May 2026) added support for keysym and text events.
libei sends logical events between a libei client and an EIS implementation (typically: a Wayland compositor) but the keyboard interface it had was designed like real keyboards: key codes together with an (XKB) key map. You press one key, the keymap decides what that key means on the compositor side and off we go. This is easy but not always useful.
As of 1.6.0 libei now also supports an "ei_text" interface. A compositor may choose to provide you[0] with a device that supports this interface and that gives you two really nice opportunities.
First, you can now send a key sym. Instead of sending the KEY_Q key code and hoping it actually translates to 'q' (and if there's e.g. a frenchman^Wfrenchperson lurking behind the keyboard it may mean 'a'), you can now send 'q' as actual keysym. Or 'Q' instead of sending shift+q and hoping for no french influence in the process. It becomes the EIS implementation's job to handle that keysym - if it's a shortcut it may handle it directly, otherwise it may pass it on via Wayland to an application[1]. This centralises the keysym to keycode handling in the EIS implementation which is a pain for compositor authors (though they likely have that code already for e.g. RDP support) but reduces the variety of differently-wrong implementations in clients and of course makes it so much simpler to write clients.
Second, a client can send UTF-8 text to the compositor. So instead of emulating shift, keycodes, etc. you can literally send "Hello World" and expect the EIS implementation to pass that one. Again, makes a bunch of utilities a lot simpler to write and I mostly leave it up to your imagination to figure out what to do with that.
Notably for both cases: libei is about logical events that have a specific meaning that do not need further interpretation. If a client sends 'Q' that means it is supposed to be an uppercase Q. Sending keysym Shift_L and Q makes little sense. And for the utf8 text events: how the text comes to be matters doesn't matter for libei so you may use an IM to make up the text to begin with and send it, once committed, to EIS. It's not for sending partial strings.
As mentioned in the previous post: the plumbing for this is already in place so both clients and compositors can add support for this new interface without having to bother the rest of the stack (e.g. portals). So, hooray I guess.
The text/keysym support is relatively recent so expect this to hit the next compositor version (or the one after that).
[0]: the EIS implementation decides which devices are available and arguing about this is even less useful than arguing with a world cup ref
[1]: after converting it to a key code with possible keymap changes... but hey, such is life
22 Jul 2026 4:16am GMT
Peter Hutterer: libei integrations in the XDG RemoteDesktop and InputCapture portals
Turns out it's been years since I've talked about eggs, so let's change this. libei is, of course, the library for Emulated Input[1].
This post is mostly a refresher because it's been so long and a short summary of some of the work we've done so far, in preparation for some more posts that come soon.
libei is a transport layer for logical input events, unlike libinput which is a hardware abstraction layer. In libinput's case the device's firmare/kernel pass events that are somewhere on the sanity spectrum, libinput tries to make sense of those and then we convert those to logical events to be consumed by the next layer (typically the Wayland compositor or Xorg). This is how e.g. "touch down at position x1/y1, touch up at position x1/y2" is converted into a button click event if touchpad tapping is enabled. Or maybe into nothing if we find it was an accidental palm touch.
libei works purely on the logical level - you as the libei client pass logical events to the EIS (Emulated Input Server) implementation (typically the compositor). No guesswork, you say button click, EIS gets a button click. libei supports a "sender" and "receiver" mode, depending on whether events are sent to the EIS implementation (input emulation) or receive from the EIS implementation (input capture). libei is designed for the Wayland stack but there are zero requirements for Wayland on either the client or the EIS implementation.
Core to libei's design is that the EIS implementation is in control of virtually everything, it decides which devices are available to the client, when those devices can send events, etc. Much like the compositor is in charge when it comes to physical devices - if a compositor decides a physical device doesn't exist, a Wayland client cannot get events from it.
Since the original proposal (again, [1]!) we've been busy bees and libei is now a part of the XDG Remote Desktop portal and the XDG Input Capture (both since version 1.17, mid 2023). In both cases the portal is for the negotiation and initial agreement of what should happen, libei is then used as the transport layer between the two processes [2].
More recently we also added session persistence support so you don't have to allow access on every connecton. Much of the work enabling this was done by Jonas Ådahl, it is now in the portals since version 1.21.0 and should be in the major compositors in the current or next versions.
Plumbing the Pipes
Getting all this into place was a huge amount of work across several pieces of the stack. This isn't exciting in the same way as laying plumbing pipes isn't particularly exciting but much like regular plumbing: once it's in place you can change your diet without severely impacting everyone again. Try get that analogy out of your head now. You're welcome.
In libei's case this means three things:
- if you have a client that uses the XDG portals to send/receive events they will now work with any compositor that implements the portal. No need for GNOME/KDE/... specific APIs.
- if you have a compositor that implements EIS you have all the infrastructure in place to talk to libei clients from somewhere else, if need be. The use-cases for this aren't fully scoped yet (assisitive technologies, virtual keyboards, touchpads, etc?) but the piping is there and ready to be (ab)used .
- since the actual events back and forth don't affect the layers in between, we can now add new events to libei without having to change everything else again.
Let's look at how this works in practice.
The XWayland XTEST use-case
An example for such a case where we can now abuse the piping is Xwayland support for XTEST. XTEST is the protocol that everyone uses to emulate input under X but in Wayland it's not hooked up to anything so those APIs simply won't work.
But what we can do in Xwayland is translate XTEST to libei events and facilitate the portal interaction. This means our stack looks roughly like this:
    +--------------------+             +------------------+
    | Wayland compositor |---wayland---| Wayland client B |
    +--------------------+\            +------------------+
    | libinput |   EIS   | \_wayland______
    +----------+---------+                \
        |          |           +-------+------------------+
 /dev/input/       +-----------| libei |     XWayland     |
                               +-------+------------------+
                                                |
                                                | XTEST
                                                |
                                         +-----------+
                                         |  X client |
                                         +-----------+
And if said X client uses XTEST to try to emulate devices, Xwayland will ask the Remote Desktop portal for permission and set up the session, then pass the XTEST events on as libei events and voila - your 20 year old X client can send pointer and keyboard events through an XDG Portal without knowing about it (and the user can prohibit this and even gets some information on who is sending events which is not possible with normal XTEST at all). This has now been supported since Xwayland 23.2.0. Compositors don't need extra support for this.
What's next
So we have a lot of the plumbing in place, or in another anology: we have a hammer, let's go looking for nails. And right now the nails we can see are sending text, gestures, and tablet support. And those will be the subject of the next few posts.
[1]: 6 years ago?! whoah...
[2]: in Remote Desktop's case replacing the DBus emulation APIs which were a Newton's Cradle of wakeups for at least 4 processes per event
22 Jul 2026 4:07am GMT
18 Jul 2026
planet.freedesktop.org
Hari Rana: How far would hostile distributions go to hurt application developers?
Introduction
The Linux desktop has an upstream maintenance problem due to many reasons for it, such as the lack of paid work. No one is entitled to a volunteer's free time apart from the volunteer themself. This is especially true to volunteers working on upstream projects, as they are at the mercy of downstream distributions, who have the final say.
As an upstream contributor, you have no choice but to meticulously plead for any reasonable request to be granted by difficult downstreams, treating them as if they are some kind of deity. Not doing so with the utmost respect can get you on their naughty list, which they can then use against you just because the license 'allows' it and they can get away with it; even shamelessly use the 'you chose the wrong license' card when they have nothing else to add.
We have seen several instances of downstreams misusing their power while simultaneously abusing upstreams' generosity and free time to do whatever they want. This was especially true with XScreenSaver and Debian in the past, which Debian has since changed its policies to communicate better with upstreams, and more recently Bottles, OBS Studio, and Fedora. This article is specific to an even more recent incident we at GNOME Calendar have had with Linux Mint.
Technical Definitions
There are a few technical definitions that should be understood before reading the rest of the article:
- Upstream: A group of individuals authoring software, for example GNOME Calendar.
- Downstream: A group of individuals building, curating, and redistributing these software to end users, for example Linux Mint.
The distribution model works until it impacts upstream
Distribution model refers to an established model that the Linux desktop has been practicing for decades, where an end user is expected to report issues to downstream, and, if necessary, downstream relays said issue to upstream.
The adage that users report issues to downstream holds true up until these users start reporting them to upstream without reporting to downstream beforehand. In reality, many distributions advertise themselves as user-friendly. Users of these distributions are unaware of the distribution model, so, in good faith, they report issues to upstream without ever knowing that they should be contacting downstream.
Often, downstream issues have already been resolved in previous releases; however, since these issues are being reported to upstream, upstream has to regularly triage and close these invalid issues. This creates an additional burden for them because they end up spending their limited volunteer time managing these issues when it should have been downstream's responsibility to ensure that the user is reporting to them first.
Contacting downstream is a burden in itself
Whenever the upstream project reaches out to the hostile downstream and asks for a change, the response is usually met with the downstream bluffing by pretending to look for a solution for a nonexistent request, such as adapting the issue tracker with the implication that upstream will have to write the template(s) themselves, and then regularly update when the message is misinterpreted, just so downstream can avoid doing any actual work. That is called moving the goalposts.
If upstream objects to these 'suggestions', this is usually done with a shift in tone, as these one-sided discussions occur in the span of weeks, if not months, if not years, which quickly drains upstream's remaining energy. When it shifts to a harsh(er) tone, the hostile downstream takes the easy way out by making remarks on that tone and acting like they are the only one being dignified; when they can, they end the discussion just because they do not like the tone and can use that tone to justify their (lack of) decision, without taking any appropriate action to remedy the underlying request.
As a result, they continue to mislead users into reporting issues to upstream, but this time intentionally and out of spite simply because free software licenses do not disallow abusing people's generosity and free time. However, you will see later that this has nothing to do with free software.
Linux Mint and GNOME Calendar
For years, we have been dealing with users reporting Linux Mint's broken packaging of GNOME Calendar to us, that were either never present or addressed releases ago.
To name a few examples:
- https://pouet.chapril.org/@parrot_33/116374864921983890(Archive)
- https://vmst.io/@doctroid/116542487573304110 (dead link)
- https://gitlab.gnome.org/GNOME/gnome-calendar/-/work_items/300
- https://gitlab.gnome.org/GNOME/gnome-calendar/-/work_items/1562
- https://gitlab.gnome.org/GNOME/gnome-calendar/-/work_items/1535
- https://gitlab.gnome.org/GNOME/gnome-calendar/-/work_items/1526
- https://gitlab.gnome.org/GNOME/gnome-calendar/-/work_items/1429
- https://matrix.to/#/!koZzDOwNHEzEoeuNok:matrix.org/$174759788212004HiyFg:gnome.org?via=gnome.org&via=matrix.org&via=fedora.im
There were a couple of discussions regarding this in the past, in chat and without my involvement, but none of them ended up being productive. Eventually, we got fed up by it and I opened ticket #1 on Linux Mint's "gnome-calendar" repository, asking them to remove all links pointing to upstream GNOME Calendar and rebranding the app:
Remove/replace links pointing to GNOME Calendar, and update branding
Being one of the core developers of GNOME Calendar, we do not support any of the versions provided and held back by Linux Mint. We would really appreciate if you could remove or replace every link, especially support links, targeting to GNOME Calendar, as well as rebranding the app icon.
Mind you, this is the first issue ever opened in the history of Linux Mint's package repository (8 years ago)! Based on the links above, I think it is safe to say that the app was broken throughout these years despite the lack of tickets.
This ticket had no response for six months, in other words half a year, all the while we were still getting bug reports about their broken package.
We eventually got fed up (again!) and pinged the packager. The packager replied and asked which modifications we did not like, conveniently ignoring our actual request.
So, I stated that we do not have the time to look through the code just to pinpoint specific issues, so I loosely said "everything"; then followed up by stating that the only solution to this is to rebrand or drop the package.1 (Of course, it should not be our responsibility as an upstream to pinpoint issues to downstream's mispackaging.)
Then, the packager responded with "I reviewed the changes. None of them are problematic.", ignoring the essence of my comment once again, and followed with a whataboutism:
[…] [GNOME Calendar] 46 and 48 are used by millions of people right now in Ubuntu LTS and Debian Stable. Are you going to request Debian and Ubuntu stop shipping GNOME apps?"
In other words: "what about Ubuntu LTS and Debian Stable?", essentially roping Ubuntu and Debian into Linux Mint's problem. As a bonus, they also twisted my words and changing the subject from "GNOME Calendar" to "GNOME apps".
So, once again, I reminded that this is not what the issue is about, and Debian and Ubuntu LTS have nothing to do with this.
As a side note: no, never would we go after Debian or Ubuntu over this. If the distribution in question is doing its job properly by simply not bothering the people writing the software that they package, then why should we go after them? They are not the ones misleading users into opening in the wrong place, so there is no reason for us to be upset about. In this case, Linux Mint is leeching off of Debian, pushing their responsibility onto us, and roping Debian into their problems.
The packager then explained the following:
If we were to stop packaging GNOME Calendar, Mint users would end up with the exact same version 46 as now. You understand that? It wouldn't magically upgrade their version of GNOME Calendar to 50+.
Very clear signs of strawman to make points against a proposal/demand that was never made, by arguing against 'stop packaging GNOME Calendar' rather than the original 'rebrand GNOME Calendar'.1
Then:
Mint 22.x is built on top of Ubuntu 24.04 LTS. Packages come from both repositories. If there's no gnome-calendar in Mint 22.x repositories, Mint 22.x users get it from the Ubuntu 24.04 repositories. The version in both repositories is 46. Removing gnome-calendar from our repositories would basically make our users switch to Ubuntu's version, which is 46 as well.
Same goes for LMDE and Debian Stable, same principle, same bug fix, with version 48.
The only way to make it so Mint doesn't have a frozen version of gnome-calendar would be to remove it from Debian. It would then disappear from future versions of Ubuntu and Mint which are based on it. If you got it removed from there we'd obviously oblige with your request not to re-add it and wouldn't do so.
These are, again, unrelated problems to the essence of the request, as the request is about rebranding, not dropping the package altogether.
So, I again reminded them that this is not our responsibility as an upstream to fix their problems.
They then 'suggested' us to add code to check if the user is running an outdated version, and then 'offered' that they will patch their existing packages and potentially Debian's and Ubuntu's as well, essentially moving the goalposts once again. They're expecting us to either phone home or somehow keep track of releases every six months.
If we were to phone home, we would need to cover more cases, such as bothering designers to find an appropriate way to display a warning to the user when they are not connected to the network or when the "gnome.org" domain is unreachable. This adds another dependency on the network for no reason.
This also adds more burden to translators: this is not a typical string where one needs to translate one word into another; the tone and vocabulary of a warning depends on the region, so translators need to adapt the vocabulary to ensure that the underlying meaning is not misinterpreted. In any case, I think it is fair to say that this is an absurd suggestion to a problem that has nothing to do with the upstream.
I lost my patience; I hostily replied that we as upstream do not care about how distributions operate, and, once again, reminded that all we want is for them to rebrand; a very simple request that was continuously red herred with bikeshedding, strawmen, whataboutisms, and moving goalposts.
When I posted that comment, I misinterpreted the message as I thought their 'offer' was them asking us to do their work, hence me stating that we do not care about how distributions operate.
The packager then replied: "If you don't care, then neither do we."; here, they are explicitly confirming that they do not care about Debian and the situation altogether. In a later comment, they stated: "probably requires GNOME Calendar to move away from free licenses" and locked the issue, which, once again, completely ignored the essence of this entire issue, but this time concluding with the 'you chose the wrong license' card.
Now, they were explicitly told what the problem was, have refused to act on it by continuing to shove their responsibilities onto us. The attitude went from doing something 'just because they can' to 'that should show upstream for hurting my feelings!', never mind the fact that we and Debian are the ones doing the hard work, which they are leeching off.
If you read through the entire ticket, you may notice a part where the packager makes a comment regarding some serious accusations. This is a response to a banned user's comment that is now deleted, who originally made these accusations.
Addendum: Past visual and behavioral changes to Calendar while retaining the brand
In addition to generally shipping outdated versions of everything, the packager has conveniently ignored some past changes around and on GNOME Calendar:
- Mint actively downgraded GNOME Calendar's version to a 2-4 years older version, to make it go from the GTK4+libadwaita version to the GTK3 version, making users needlessly experience hundreds of old bugs that had long been fixed by the GNOME Calendar developers
- Mint then forked libadwaita into libAdapta, and made their version of GNOME Calendar use that
- libAdapta is now years behind libadwaita in terms of features, based on version 1.5 of libadwaita while libadwaita is at version 1.9
This can be seen in various blog posts from Mint, such as the ones cited below:
In Mint 22 GNOME Font Viewer was removed and the following applications were downgraded back to GTK3 versions:
- Celluloid
- GNOME Calculator
- Simple Scan
- Baobab
- System Monitor
- GNOME Calendar
- File Roller
- Zenity
These applications are very likely to be forked in the near future, except for Zenity which we'll probably stop using altogether.
- https://blog.linuxmint.com/?p=4675
With the release of Linux Mint 22, GNOME Apps which used libAdwaita were downgraded back to their GTK3 versions so that they could continue to function properly in the desktop environments we support. This was a temporary solution until these applications either got replaced, removed, forked, or until we found a way to continue to use them.
- https://blog.linuxmint.com/?p=4840
libAdwaita apps and patches
Starting with Linux Mint 22.2, libAdwaita will be patched to work with themes. Support for libAdwaita was added to Mint-Y, Mint-X and Mint-L.
The following apps will be upgraded to their libAdwaita versions:
- gnome-calendar
- simple-scan
- baobab
libAdapta fork
In the scope of XApp and for our own projects, libAdwaita was forked into libAdapta
- https://blog.linuxmint.com/?p=4850
Trademark and free software
As explained above, this actually has nothing to do with free software; rather, this is a question about trademarks: Linux Mint is allegedly2 (mis)using GNOME's name by redistributing unsupported builds while pretending that they are supported by us, and is actively misleading users to avoid supporting them.
Offending distributions use the 'you chose the wrong license' card because it is simultaneously very difficult to correct them as a non-lawyer, while being looked positively throughout the free software community. However, they know very well that looking at the situation from the perspective of trademark usage rather than software licensing would make it significantly harder to defend themselves, so naturally they opt into using (the incorrect) free software licensing as a gotcha.
Addendum 2: Potential license violation
GNOME Calendar is licensed under GPL-3.0-or-later, so let's look at what the license states:
For both users' and authors' sake, the GPL requires that modified versions be marked as changed, so that their problems will not be attributed erroneously to authors of previous versions.
[…]
The work must carry prominent notices stating that you modified it, and giving a relevant date.
[…]
Notwithstanding any other provision of this License, for material you add to a covered work, you may (if authorized by the copyright holders of that material) supplement the terms of this License with terms:
[…]
- Prohibiting misrepresentation of the origin of that material, or requiring that modified versions of such material be marked in reasonable ways as different from the original version; […]
Here, the license states that 1. the modified versions (Mint) must be marked as changed so that future problems are not mistakenly attributed to the original authors (GNOME Calendar), 2. the changes must be explicitly stated in modified versions, and 3. the modified version must not misrepresent the authors' work.
Linux Mint has not stated any changes, nor have they deviated from the GNOME brand. This can be seen in the metadata file where it is identical to the metadata provided in GNOME Calendar 48.1 In their website, they show a screenshot of the GTK3 version of GNOME Calendar, but call it "GNOME Calendar" which it is not, thanks to their modifications. Seeing the non-exhaustive list of examples of bug reports and posts on social media we have seen, I think it is fair to say that their problems are attributed erroneously to us.
Even then, besides all this, we put in the effort to go through Mint's website and source code to list these problems, not Mint. This should not have been our responsibility to begin with.
Tone is irrelevant
The issue itself was originally calm and straight to the point. Half a year passed by and there was no response. Then, the packager was pinged, they chimed in, and changed the subject immediately. The tone shifted, and they took the easy way out by locking the issue and misleadingly stating that this is an upstream problem for choosing the wrong license.
In other words, you have two choices:
- You kindly ask, and nothing happens apart from your own time and energy getting wasted for a considerable amount of time, with constant red herring or silence.
- You start acting like a 'dick', and now they use this as an excuse to no longer communicate with you, all the while still refusing to address the underlying issue.
As an upstream, it is a lose-lose situation with hostile downstreams such as Linux Mint. Once they start packaging your software, they immediately burn their bridges implicitly. In order to show that they are 'good', they only pretend to care about the problem, and keep proposing 'solutions' that 1. have nothing to do with the underlying problem, and 2. put on significantly more burden to upstream without putting an equal amount of effort themselves.
The reason there are so little undocumented cases is because many maintainers who deal with hostile downstreams are usually indie-developers that have very little resources and energy to deal with these problems, and have very little to no understanding with trademarks and legality.
They get burned out, stop developing and contributing to free software, and (rightfully) lose hope for the Linux desktop. They do not make any of it public or make a fuss about the situation because they do not feel comfortable to be in the middle of a conflict publicly. All they want is to just enjoy providing goods to the world, but are unfortunately bullied by repackaging fetishists whenever they raise a legitimate issue.
Conclusion
To summarize all this, hostile downstreams have already gone as far as to burn their bridges with upstreams. Any upstream is at a lose-lose position no matter how kind or unkind they are. If they are kind, they will be on the waiting list for as long as governments put patients on the waiting list for medical care. If they are 'rude', hostile downstreams will use this tone against them. If upstream sends out a cease and desist letter, the free software community will start seeing them as the Nintendo of free software and conflate volunteers who are fed up with hostile downstreams, with corporations that sue every sentient being that breathes.
18 Jul 2026 12:00am GMT
14 Jul 2026
planet.freedesktop.org
Tomeu Vizoso: Ethos-U NPU update 1: The journey to a production-ready mainline driver
Background
Among Arm's portfolio of IP blocks is the Ethos-U product line, offering acceleration of neural networks at low power and low latency. Arm calls them micro NPUs and though they indeed contain lower numbers of compute units, in my testing they can match the performance of NPUs with up to six times more compute units. In my opinion this is due to a very clean architecture in which the different sub-blocks fit very well with each other, and an excellent software stack that allows for very decent occupancy rates.
Of the SoCs supported by the mainline Linux kernel and containing a Ethos-U NPU, the most popular is NXP's i.MX93, which contains an Ethos U-65 with an advertised 0.5 TOP/s and 640 KB of SRAM.
 |
| The author's desk got messier by one board |
Arm's software stack to go with their IP includes on the low-level side a firmware running on a companion Cortex-M core, an out-of-tree kernel driver and a compiler called Vela that lowers a hardware-independent machine learning graph to the commands that the hardware understands. Their software stack also includes complete and high-quality hardware documentation that made the implementation of the mainline driver much more efficient.
In my conversations with SoC vendors, the mediation of the Cortex-M meant that the ML models couldn't co-execute efficiently on the CPU and NPU, and was cumbersome for their customers to deploy new models.
The other concern that I heard from SoC vendors and some of their customers was that even though Arm's software stack for the Ethos-U was open source, it wasn't pre-integrated in the Linux distributions that they were using, and there wasn't a standard path for contributing changes back as there is in established, multi-vendor open-source upstream projects.
Mainline
To solve this deployment friction and eliminate the need for firmware mediation, the community turned to the mainline Linux kernel.
Rob Herring, widely known in the Linux community from his work on the Device Tree infrastructure, started a completely new kernel driver a bit over a year ago in the DRM/Accel subsystem that would drive the Ethos-U directly from the main CPU, bypassing the Cortex-M and thus the need for firmware. The driver uses the established DRM practices for UAPI and reuses code from the DRM subsystem such as GEM and gpu-drm-scheduler. This driver was merged into the 6.19 version of the Linux kernel, supporting right from the start the i.MX93 SoC from NXP.
In parallel, I started work on the Mesa side, where the userspace portion of DRM drivers are developed. Mesa already contained at that point support for the NPUs from VeriSilicon/Vivante and those found in Rockchip SoCs, so it was quite straightforward to add a third one. The userspace portion of the driver is in charge of translating the machine learning model into the programming of the accelerator hardware, typically divided into hardware configuration and data payloads such as operator coefficients which can be highly compressed.
The hardware drivers in Mesa share code in the form of backends for machine learning frameworks and the related testing and profiling infrastructure. Right now Mesa contains a TensorFlow Lite delegate and a PyTorch/ExecuTorch backend is in development.
The Ethos-U architecture is very clean, as mentioned above, and allows for easy implementation of new operations as used in ML models. Below are the operations currently implemented, as needed by the models that are currently supported and under regression testing.
| NPU opcode | TFLite operations |
|---|---|
| NPU_OP_CONV / NPU_OP_DEPTHWISE | Convolution, Fully Connected |
| NPU_OP_POOL | Max and Average Pooling |
| NPU_OP_POOL (NOP) | Concatenation, Strided Slice, Resize |
| NPU_OP_ELEMENTWISE | Add, Mul, Maximum, Minimum |
| NPU_OP_ELEMENTWISE (LUT) | Logistic, Tanh, HSwish, Leaky Relu |
| (fused / passthrough) | Pad, Quantize, Reshape |
Among the features that the mainline driver stack already supports are:
- different quantization schemes such as affine per-tensor and per-channel quantization, and signed and unsigned 8-bit integers,
- different schemes of coefficient compression as supported by the hardware decoder, and
- several performance counters for analyzing execution and maximizing occupancy.
When using TensorFlow Lite for inference, the models below are supported:
| Model | Operations | Operation types |
|---|---|---|
| MobileNet V1 | 31 | Conv2D, DWConv, Reshape, Softmax |
| MobileNet V2 | 65 | AvgPool, Conv2D, DWConv, Reshape |
| SSDLite MobileDet | 125 | Concat, Conv2D, Custom(Detect), DWConv, Logistic, Reshape |
| SSD MobileNet V2 | 111 | Concat, Custom(Detect), DWConv, Dequant, Logistic, Quantize, Reshape |
| YOLOX Nano | 154 | Concat, Conv2D, Logistic, MaxPool, Mul, Reshape, ResizeNN, ScatterNd, Slice, Sub, Transpose |
| EfficientDet Lite0 | 267 | Concat, Conv2D, DWConv, Dequant, GatherND, Logistic, MaxPool, Pad, Reshape |
| Inception V1 | 83 | AvgPool, Concat, MaxPool, Reshape, Softmax |
| MicroNet Large | 14 | AvgPool, DWConv, Reshape |
| MoveNet Lightning | 157 | ArgMax, Concat, Conv2D, DWConv, Dequant, Div, FloorDiv, GatherND, Logistic, Mul, Pack, Quantize, Reshape, ResizeB, Sqrt, Sub, Unpack |
| MoveNet Thunder | 157 | ArgMax, Concat, Conv2D, DWConv, Dequant, Div, FloorDiv, GatherND, Logistic, Mul, Pack, Quantize, Reshape, ResizeB, Sqrt, Sub, Unpack |
More recently, support for the Ethos-U85 generation was added, as included in Arm's hardware simulator and in SoCs such as Alif's Ensemble E8. This version of the NPU IP contains improvements intended for more efficient support for transformer-based models, such as VLMs and LLMs. With the upcoming support for ExecuTorch in Mesa, users will be able to use PyTorch to optimize models for this hardware and ExecuTorch to deploy them to their edge/IoT hardware.
Important upcoming work includes performance improvements that will target reduced total memory usage and bandwidth and maximization of SRAM usage.
14 Jul 2026 10:11am GMT
09 Jul 2026
planet.freedesktop.org
Sebastian Wick: Display Next Hackfest 2026
This year was the fourth year in a row that a bunch of display driver and compositor developers met for the Display Next Hackfest, to discuss, present, and tackle issues related to displays, GPUs, and compositors. Thanks to Collabora (Robert Mader and Mark Fillion specifically) for continuing this tradition!
(Check out the 2025 edition)
This time we met in Nice, France, after Embedded Recipes and right next to the PipeWire and libcamera hackfests. I took the opportunity to have a chat with the PipeWire developers about Flatpak, Portals, and the direction we would like to take in regard to video and audio access. Arun Raghavan has a nice summary if you're interested.
That also brings me to another point: I have mostly stopped working on compositor and color-related areas. It's not because I lost interest, but rather that I took over Flatpak and Portals maintenance. That by itself was taking a big chunk of time, but then LLMs became good at finding security vulnerabilities and now this takes more time than I have.
Before the hackfest, I sat down for one week and hacked on Mutter (the GNOME Shell compositor) to create a prototype with all the changes I wanted to do but never found the time for:
- dropping colord
- configuring ICC profiles and white point via the display config
- splitting our color transformation code to provide a color pipeline
- offloading color transforms to the KMS color pipeline
- achieving color-accurate white point adjustment and night light
With the prototype done, I made my way to Nice, taking a sleeper train from Paris and waking up to the Côte d'Azur in the morning. Then I met with Robert in the botanic garden, where he used his deep cross-stack offloading knowledge to test a bunch of video playback scenarios.
Over the hackfest days we found some glitches in the AMD driver, which were promptly fixed by Harry Wentland. We also had some discussions on strategies to do KMS color pipeline offloading, which prompted some changes in the prototype, and now have something we can start upstreaming.
For the KMS color pipeline, we got a new fixed matrix operation for YCbCr to RGB conversion, and new named curves for important video playback cases. We talked about control over the color format on the cable (which has been merged by now), as well as control over the minimum BPC.
Another thing that we all got annoyed by was all the funky colors our in-kernel console became when our offloading worked a bit too well. We've wanted a reset mechanism for KMS for a few years now anyway, so we decided to prototype it and test it on Smithay. Proper patches are now on the mailing list thanks to Maxime Ripard.
Mario Limonciello managed to push out patches for backlight support via KMS before the hackfest - another thing we've wanted for years. We tested them on Mutter, and KWin added support for it as well.
Xaver Hugl showed that we can easily support AMD FreeSync Premium Pro, the worst name for a feature that is essentially Source-Based Tone Mapping (SBTM). We also got good news regarding SBTM on HDMI. In general, it looks like we might finally get HDR that isn't entirely awful.
DisplayID, the replacement for EDID, is going to become much more prevalent, and we discussed how we're going to roll out support in the kernel and in libdisplay-info.
We once again managed to put enough wayland developers in a room for a bigger protocol change to get merged. This time it was multi device dmabuf feedback which made Victoria Brekenfeld happy.
There was a lot more happening - check out Xaver's and Louis Chauvet's blog posts.
Even though I wasn't as prepared as the previous times, it was very productive and there was more actual hacking this year. I also enjoyed meeting everyone again a lot, hanging out in the water while watching the 1% take off in their private jets, struggling to find an adequate Döner, and eating lots of pizza.
Until next time!
09 Jul 2026 1:28pm GMT
25 Jun 2026
planet.freedesktop.org
Lennart Poettering: Mastodon Stories for systemd v261
On June 19 we released systemd v261 into the wild.
In the weeks leading up to that release (and since then) I have posted a series of serieses of posts to Mastodon about key new features in this release, under the #systemd261 hash tag. In case you aren't using Mastodon, but would like to read up, here's a list of all 27 posts:
- Post #1: El-Torito/ISO9660 Support in systemd-repart
- Post #2:
ConditionFraction= - Post #3: Minimal Uptime
- Post #4: Automatic
console=Initialization from UEFI - Post #5:
bootctl link - Post #6: Importing UEFI Keyboard/Language Settings into the OS
- Post #7:
systemd-sysinstall - Post #8: Machine Tags
- Post #9: IMDS Support
- Post #10: Boot Secrets
- Post #11: Automatic Software TPM Support
- Post #12:
systemd-bootA/B - Post #13: Sector Size Adjustment for Boot Block Devices
- Post #14:
kexecHandover - Post #15:
systemd-repart'sBlockDeviceReplace= - Post #16:
.rrDrop-ins forsystemd-resolved - Post #17:
systemd-report-cgroup&systemd-report-basic - Post #18: No More Shared Libray Linking
- Post #19: IO & CPU Pressure Handling
- Post #20:
varlinkctl serve - Post #21: Separator & SMBIOS Measurements
- Post #22: BPF-LSM Based File System Security
- Post #23: Application of
confext&sysextfrom theìnitrd - Post #24:
extrastanza in UAPI.1 Boot Loader Specification - Post #25: PROXY-v1 Protocol Support
- Post #26: Storage Providers
- Post #27:
systemd-oomdRules FIles
I intend to do a similar series of serieses of posts for the next systemd release (v262), hence if you haven't left tech Twitter for Mastodon yet, now is the opportunity. My series for v262 will begin in a few weeks most likely, under the #systemd262 hash tag.
In case you are interested, here is the corresponding blog story for systemd v260, here for v259, here for v258, here for v257, and here for v256.
25 Jun 2026 10:00pm GMT
20 Jun 2026
planet.freedesktop.org
Hari Rana: Draft-Driven Blogging
From 2021 to 2023, I was really motivated to write articles regularly, but that is no longer the case. Most of my energy goes into programming nowadays. Whenever I try to write about a complicated topic in a digestible manner, I quickly lose motivation and don't publish it.
For half a year, I've been trying to write an article about the thought process that went through when making the month view in GNOME Calendar accessible, as well as the implementation details. However, explaining complicated technical details into something that is simultaneously digestible to non-developers interested in accessibility and free and open-source calendar application developers requires me to withdraw my knowledge and assumptions, consider the perspective of someone who is not knowledgeable in this topic, and then recall the events that led me to take certain decisions, which demands a lot of energy.
Due to a lack of motivation, I want to try a different approach. I am calling this approach "draft-driven blogging". Instead of publishing articles once they are complete, I will publish the draft publicly. This draft may contain keywords, incomplete sentences, random notes, empty sections and other characteristics that are only found in drafts. I will then iteratively improve the draft until it is considered finished.
This approach makes sense to me in terms of publishing and getting things done. I tend to seek perfection, which is great for maximizing quality, but it comes at the cost of motivation. Without external pressure, I am not motivated to fix something if it is not already publicly available. Seeing an unfinished blog post publicly is simply appalling. As it's ugly, it motivates me to fix and complete it. So, instead of writing and publishing the 'perfect' article, I publish the ugly draft and complete it out of spite. Maybe "spite-driven blogging" is a better term for it?
Of course, communication is important. With drafts, I will add a disclaimer stating that the article in question is a draft. The published date will be the date of the last edit, and all previous drafts will be deleted. To avoid spamming RSS feeds and notifications, I will try to republish drafts infrequently.
It's all an experiment; it might work well, or it might not. I might keep this approach or just pretend that I never tried it in the first place. We'll see.
20 Jun 2026 12:00am GMT
19 Jun 2026
planet.freedesktop.org
Christian Gmeiner: The Diagonal Seam
Two more dEQP tests down:
dEQP-GLES3.functional.fbo.blit.rect.nearest_consistency_mag -- Pass
dEQP-GLES3.functional.fbo.blit.rect.nearest_consistency_min -- Pass
This one was a fun geometry puzzle.
The problem
Mesa's u_blitter is the utility that drivers use for framebuffer blits - copying pixel data between surfaces, optionally scaling and filtering. It works by drawing a textured quad: set up the source as a texture, the destination as a render target, and draw a rectangle with the appropriate texture coordinates. Simple.
Except the quad is made of two triangles. And that diagonal seam between them is where the trouble starts.
 v2 -------- v3
  |  \   T2  |
  | T1  \    |
  |       \  |
 v0 -------- v1
For LINEAR filtering, this is fine - the interpolation across the seam is smooth enough that nobody notices. But for NEAREST filtering, a texel is selected based on which texel center is closest to the interpolated texture coordinate. At the diagonal seam, the two triangles can produce slightly different texture coordinates for pixels that sit right on the boundary. Different coordinates mean different nearest-texel selection, and that means an inconsistent stripe of wrong texels running diagonally across the blit.
The dEQP nearest_consistency tests specifically check for this: they blit with NEAREST filtering and verify that every pixel picks the same texel regardless of which triangle it fell into.

What others do
This isn't a new problem. V3D already has a workaround in u_blitter: it sets use_index_buffer to reorder the triangle indices so that the shared edge of the two triangles is along a different diagonal. This changes which pixels land on the seam and can be enough to pass the tests on some hardware.
On GC7000, that wasn't sufficient. The floating-point interpolation differences are large enough that the seam remains visible regardless of which diagonal you pick.
What the blob does
Looking at command stream traces from the proprietary Vivante driver, the answer was clear: they don't draw a quad at all. They draw a single oversized triangle and let the scissor clip it to the destination rectangle.
No seam, no problem.
The single triangle transform
The idea is simple: take a rectangle and find a single triangle that fully covers it. The smallest such triangle is a right triangle with legs twice the width and twice the height of the rectangle:
 v2
  |\
  |  \
  | rect\
  |------+\
  |      |  \
 v0 -----|--- v1
Vertex 0 stays at the rectangle's top-left corner. Vertex 1 extends to twice the rectangle width. Vertex 2 extends to twice the rectangle height. The original rectangle is fully contained within this triangle.
The math for transforming the blitter's 4-vertex quad into a 3-vertex triangle is:
for (unsigned a = 0; a < 2; a++) {      /* pos and texcoord */
   for (unsigned c = 0; c < 4; c++) {   /* xyzw components */
      float v0 = ctx->vertices[0][a][c];
      ctx->vertices[1][a][c] = 2.0f * ctx->vertices[1][a][c] - v0;
      ctx->vertices[2][a][c] = 2.0f * ctx->vertices[3][a][c] - v0;
   }
}
This transforms both position and texture coordinates consistently, so the texture mapping across the visible (scissored) region is identical to what the full quad would have produced - minus the seam.
Scissor is essential
The oversized triangle extends beyond the destination rectangle, so we need scissor to clip it. The blitter doesn't always have a scissor set up, so when use_single_triangle is enabled, we synthesize one from the destination box:
if (ctx->base.use_single_triangle && !scissor) {
   synth_scissor.minx = MAX2(dstbox->x, 0);
   synth_scissor.miny = MAX2(dstbox->y, 0);
   synth_scissor.maxx = dstbox->x + dstbox->width;
   synth_scissor.maxy = dstbox->y + dstbox->height;
   scissor = &synth_scissor;
}
Keeping it scoped
The single-triangle transform should only apply to blit operations, not to clears or other blitter draws. A transient single_triangle_active flag is set around the actual blit draw calls and checked in the vertex emission code. Drivers opt in by setting use_single_triangle on the blitter context at creation time.
For etnaviv, that's a single line:
ctx->blitter->use_single_triangle = true;
The design
The implementation is split into two commits: the u_blitter.c infrastructure (vertex transform, synthesized scissor, gating flag, 3-vertex draw path) that any driver can opt into, and the one-line etnaviv enablement. Keeping them separate means another driver hitting the same seam can flip the flag without touching u_blitter code.
The work landed upstream in u_blitter: Add single-triangle draw mode for NEAREST blit consistency.
The takeaway
Sometimes the fix for a rendering artifact isn't better math or tighter tolerances - it's removing the geometric feature that causes the problem in the first place. Two triangles have a seam. One triangle doesn't.
19 Jun 2026 12:00am GMT
14 Jun 2026
planet.freedesktop.org
Matthias Klumpp: Introducing pkgcli: A nicer command-line interface for PackageKit
For almost two decades, the PackageKit package management abstraction layer has shipped with pkcon as its command-line client. pkcon does its job, but it was always kind of a "testing" front-end for the PackageKit daemon rather than a tool designed for everyday use. The focus has instead been on the GUI tools, automatic system updates, GUI application managers and other front-ends. Its command names mirror the D-Bus API almost one-to-one (get-details, get-updates, get-depends), output is very plain, and there is no machine-readable mode for scripting. Most importantly though, there has been no development on it at all for almost a decade, so pkcon was stuck in its rudimentary state from that era.
Since a lot of changes will be coming to PackageKit, and testing the daemon and working with it from the command-line was not very pleasant anymore in 2025/2026, I decided to modernize the tool as part of my work as fellow for the Sovereign Tech Agency last year. pkgcli is the new command-line client for PackageKit. It is built from the ground up to be pleasant to use interactively and easy to drive from scripts.
Why a new tool?
Of course, instead of introducing a new tool, I could have just expanded pkcon instead. The problem with that approach is that the pkcon utility has been around for so long and its command-line API had ossified so much, that rather than changing it and potentially breaking a lot of scripts relying on its quirks, I decided to introduce a new tool instead. pkcon can still be optionally compiled for people who need it in their scripts and workflows.
The goals for pkgcli, and the features it now has are:
- Human-friendly command names. Verbs that read the way you'd describe the task, instead of mirroring the D-Bus API 1:1:
show,search,list-updates,what-provides, instead ofget-detailsand friends. - Readable, colored output by default (still respecting
NO_COLORand degrading gracefully). - A real scripting mode. A global
--jsonflag emits JSONL instead of fully human-readable output when possible, to make it easier to use the tool for scripting purposes. - Sensible defaults. A few defaults have been changed, such as the metadata cache-age, or automatic cleanup of unused dependencies being enabled by default. This is more in line with current defaults by other tools and frontends. We also print package information in a slightly different, more readable way.
- Better handling of internationalized text. Text should now align properly in the terminal window, and we should no longer have completely chaotic text output on non-English locales (especially Chinese/Japanese).
Why not pkgctl?
Originally, this tool was called pkgctl, to match other common cross-distro tool names. However, that name was already taken by an Arch-specific distro development tool. When this issue was raised, we decided to just rename our tool to pkgcli with the next release, to avoid the name clash on Arch Linux.
Examples!
Here are some examples on how to use the new tool (some of which include the abridged output pkgcli prints).
Search for anything containing the string "editor" in name or description, then look at the details of one result:
$ pkgcli search editor
Querying                  [████████████████████████████████████████] 100%
▣ ace-of-penguins 1.5~rc2-7.amd64 [debian-testing-main]
▣ acorn-fdisk 3.0.6-14.amd64 [debian-testing-main]
▣ ardour 1:9.2.0+ds-1.amd64 [debian-testing-main]
✔ audacity 3.7.7+dfsg-1.amd64 [manual:debian-testing-main]
✔ audacity-data 3.7.7+dfsg-1.all [auto:debian-testing-main]
▣ augeas-tools 1.14.1-1.1.amd64 [debian-testing-main]
▣ emacs 1:30.2+1-3.all [debian-testing-main]
▣ gedit 48.1-9+b1.amd64 [debian-testing-main]
▣ gedit-common 48.1-9.all [debian-testing-main]
▣ gedit-dev 48.1-9+b1.amd64 [debian-testing-main]
[...]

$ pkgcli show nano
Package: nano
Version: 9.0-1
Summary: small, friendly text editor inspired by Pico
Description: GNU nano is an easy-to-use text editor originally designed as
 a replacement for Pico, the ncurses-based editor from the non-free mailer
 package Pine.
[...]
URL: https://www.nano-editor.org/
Group: publishing
Installed Size: 2.9 MB
Download Size: 646.0 KB
Search only within package names rather than descriptions:
$ pkgcli search name python3Check for updates. refresh updates the metadata, then list-updates reports what's available:
$ pkgcli refresh && pkgcli list-updates
Loading cache            [████████████████████████████████████████] 100%
▲ cme 1.048-1.all [debian-testing-main]
▲ gir1.2-gdm-1.0 50.1-2.amd64 [debian-testing-main]
▲ imagemagick 8:7.1.2.24+dfsg1-1.amd64 [debian-testing-main]
▲ imagemagick-7-common 8:7.1.2.24+dfsg1-1.all [debian-testing-main]
▲ imagemagick-7.q16 8:7.1.2.24+dfsg1-1.amd64 [debian-testing-main]
▲ libdlrestrictions1 0.22.0.amd64 [debian-testing-main]
▲ libfftw3-bin 3.3.11-1.amd64 [debian-testing-main]
▲ libfftw3-dev 3.3.11-1.amd64 [debian-testing-main]
Explore relationships between packages:
$ pkgcli list-depends inkscape  # list what inkscape depends on
$ pkgcli list-requiring libappstream5  # list what requires libappstream5
Find the package that provides a capability, here the AV1 GStreamer decoder:
$ pkgcli what-provides "gstreamer1(decoder-video/x-av1)"
✔ gstreamer1.0-plugins-bad 1.28.3-1.amd64 [auto:debian-testing-main]
You can also have JSON output for most commands! Attach --json to any query and pipe the result straight into jq. Each line is a self-contained JSON object:
$ pkgcli --json list-updates | jq -r '.name'
cme
gir1.2-gdm-1.0
imagemagick
imagemagick-7-common
imagemagick-7.q16
libdlrestrictions1
libfftw3-bin
libfftw3-dev
libfftw3-double3
Try it
pkgcli is built by default alongside the rest of PackageKit since PackageKit 1.3.4. If your distribution ships a recent enough PackageKit, it should already be on your PATH. You can read its man page man pkgcli for more information. Feedback, bug reports, and patches are very welcome.
14 Jun 2026 6:22am GMT
10 Jun 2026
planet.freedesktop.org
Christian Gmeiner: Fixing the R/B swap the right way
If you've ever looked at a GPU render and seen blue where red should be, you've met the R/B swap problem. For etnaviv this has been a long-standing source of complexity. We were solving it in the shader, but the proprietary blob driver had a simpler approach all along. As part of my work at Igalia, I finally sat down and did it properly.
The problem
Vivante GPUs have a quirk: the Pixel Engine (PE) always writes pixels in BGRA byte order. When your API says "render to R8G8B8A8_UNORM", what actually lands in memory is B, G, R, A. Every byte of every pixel, every frame. The hardware just works that way.
The question is: where do you fix it?
The etnaviv driver was doing it in the shader. Before the fragment shader writes its output, a NIR lowering pass swaps the R and B channels:
   alu->src[0].swizzle[0] = 2;   /* .r reads from .b */
   alu->src[0].swizzle[2] = 0;   /* .b reads from .r */
This works, until it doesn't. The shader key needs a frag_rb_swap bitmask per render target. The blend color needs per-RT R/B swapping to match. And it falls apart entirely for scalar outputs - if a shader writes a single float, there's no .z component to swizzle into .x. That's exactly the NIR validation failure we hit:
Test case 'dEQP-GLES3.functional.fragment_out.basic.fixed.rgb8_lowp_float'..
NIR validation failed after etna_lower_io in ../mesa/src/gallium/drivers/etnaviv/etnaviv_compiler_nir.c:1296
1 errors:
shader: MESA_SHADER_FRAGMENT
source_blake3: {0x4d463d73, 0x4b27d742, 0x27a92b64, 0x375c010f, 0xb2ce3767, 0x2adc55cc, 0x6da8105b, 0x5b9fce29}
name: GLSL1
prev_stage: MESA_SHADER_VERTEX
inputs_read: 32
outputs_written: 4
perspective_varyings: 32
max_subgroup_size: 128
min_subgroup_size: 1
api_subgroup_size_draw_uniform: true
first_ubo_is_default_ubo: true
known_interpolation_qualifiers: true
flrp_lowered: true
inputs: 1
outputs: 1
decl_var shader_in INTERP_MODE_SMOOTH none highp float packed:var0 (VARYING_SLOT_VAR0.x, 0, 0)
decl_var shader_out INTERP_MODE_NONE none mediump float out0 (FRAG_RESULT_DATA0.x, 0, 0)
decl_function main () (entrypoint)

impl main {
    block b0:  // preds:
    32    %3 = load_const (0x00000000)
    32    %4 = @load_input (%3 (0x0)) (base=0, range=1, component=0, dest_type=float32, io location=VARYING_SLOT_VAR0 slots=1)  // packed:var0
    32    %2 = deref_var &out0 (shader_out mediump float)
    32    %5 = mov %4.z
error: src->swizzle[i] < num_components (../mesa/src/compiler/nir/nir_validate.c:217)

               @store_deref (%2, %5) (wrmask=x, access=none)
               // succs: b1
    block b1:
}

FATAL ERROR: Test program crashed
What the blob does
Looking at command stream traces from the proprietary driver, the answer is almost disappointingly simple. Instead of this:
  Texture format: A8B8G8R8     (read BGRA as BGRA)
  PE format:      A8B8G8R8     (write BGRA)
  Shader:         swap R <-> B
The blob does this:
  Texture format: A8R8G8B8     (read BGRA as RGBA - hardware swaps on read)
  PE format:      A8B8G8R8     (write BGRA - unchanged)
  Shader:         nothing
That's it. Tell the texture sampler the data is A8R8G8B8, and it will correctly interpret the BGRA bytes as RGBA channels. The PE keeps writing BGRA because that's what it does. No shader modification needed.
In our format table, the change is a single field:
  -  VT(R8G8B8A8_UNORM, UNSIGNED_BYTE, A8B8G8R8, A8B8G8R8)
  +  VT(R8G8B8A8_UNORM, UNSIGNED_BYTE, A8R8G8B8, A8B8G8R8)
                                        ^^^^^^^^
                                     texture format
The data flow
To understand why this works, trace a red pixel through the pipeline:
                          BGRA-internal byte order
                         +------------------------+
                         |                        |
  API: glClear(1,0,0,1)  |   Memory: [0,0,255,255]|   CPU: expects [255,0,0,255]
  "red = 1.0"            |   (B=0, G=0, R=255,    |   "RGBA order"
                         |    A=255)              |
                         +------------------------+

  +-----------+     +--------+     +--------+     +---------+
  | Shader    |     | PE     |     | Memory |     | Sampler |
  | out=RGBA  | --> | writes | --> | stores | --> | reads   |
  | (1,0,0,1) |     | BGRA   |     | BGRA   |     | as      |
  |           |     |        |     | bytes  |     | A8R8G8B8|
  +-----------+     +--------+     +--------+     +---------+
       |                |               |              |
    R=1.0            B=0x00          [00 00 FF FF]   R=1.0
    G=0.0            G=0x00                          G=0.0
    B=0.0            R=0xFF                          B=0.0
    A=1.0            A=0xFF                          A=1.0
The shader writes (1,0,0,1). The PE swaps R/B on write, so memory gets [0,0,255,255] in BGRA order. The sampler, told the format is A8R8G8B8, reads those same bytes back as (1,0,0,1). Round-trip complete, no shader involvement.
The CPU boundary problem
GPU-to-GPU is clean. But what happens at the CPU boundary - glReadPixels, glTexSubImage, glBlitFramebuffer to a CPU-mapped buffer? The CPU expects RGBA byte order. Memory has BGRA. Something needs to swap.
This is where the hardware copy/resolve engines come in - RS and BLT. Both can perform R/B swapping during their copy operations. The RS engine has a swap_rb bit. The BLT engine has per-side swizzle fields. We just need to activate this at the right moment.
The key insight: only transfer blits (tiled-to-linear copies for CPU access) need the swap. GPU-internal blits - glBlitFramebuffer between two render targets, TS resolve, mipmap generation - are all operating on data already in BGRA order on both sides. Swapping there would be wrong.
So we gate it with a context flag:
ctx->in_transfer_blit = true;
etna_copy_resource_box(pctx, trans->rsc, &rsc->base, ...);
ctx->in_transfer_blit = false;
And in the RS blit path:
.swap_rb = ctx->in_transfer_blit &&
           translate_pe_format_rb_swap(blit_info->src.format),
The texture shadow trap
With the basic approach working, tests passed on GC7000 (BLT engine). But GC2000 (RS engine) had a regression: fbo-blit showed blue where red should be.
After adding debug prints and tracing the code paths, the culprit was the texture shadow. Some resources can't be sampled directly by the texture unit - for example, a render target might use a layout the sampler doesn't understand. For these, the driver allocates a second copy of the resource in a sampler-compatible tiled layout. This is the "texture shadow".
The shadow is a workaround that hurts performance - it means extra memory and extra copies. Ideally we wouldn't need it at all. But while it exists, the driver uses it as a shortcut for CPU transfers: read directly from the shadow and detile in software, skipping the blit engine:
Passing probes:  PATH=temp_resource+RS_blit    swap_rb=1   -> correct
Failing probes:  PATH=texture_shadow                       -> R/B swapped
The texture shadow path does a software detile - raw byte copy, no R/B swap. With BGRA-internal byte order, that gives you BGRA bytes on the CPU side. Wrong.
The fix: skip the texture shadow shortcut for formats that need R/B swap, forcing through the blit engine path which handles the conversion:
if (rsc->texture && !etna_resource_newer(rsc, etna_resource(rsc->texture)) &&
    !translate_pe_format_rb_swap(prsc->format)) {
   /* Use texture shadow - safe, no R/B swap needed */
   rsc = etna_resource(rsc->texture);
} else {
   /* Use blit engine - handles R/B swap correctly */
   ...
}
Results
This is a net-negative patch series - 15 files changed, 76 insertions, 113 deletions. The etnaviv: Remove RB swap logic in the fragment shader contains all that's needed:
- blt: Use img->swizzle for CONFIG SWIZ fields - preparation for per-image swizzle support
- Add translate_pe_internal_format helper - maps RGBA pipe formats to BGRA equivalents for clear color packing
- Use BGRA-internal texture format with BLT/RS R/B swizzle - the main change
- Compute blend color directly in etna_set_blend_color - simplifies blend color, no deferred update needed
Fixes the NIR validation failure with scalar fragment outputs. And as a nice side effect, removing the shader-based swap means fewer shader variants, fewer instructions and less overhead. glmark2-es2-wayland improves from ~835 to ~874 FPS - a 4.7% performance increase.
Sometimes matching what the hardware vendor does is the right answer. The blob driver figured this out years ago. We just needed to look at the traces.
That's where I thought the story ended
The texture-format trick has a hidden assumption baked into it: that the GPU both writes and reads every resource. The PE writes BGRA, the sampler is told the format is A8R8G8B8, and the byte order cancels out. It's a closed loop, and as long as the data never leaves the GPU, nobody outside ever sees the BGRA bytes.
dmabuf breaks the loop.
When a buffer is shared with another process - a Wayland compositor, a video decoder, a camera - the byte order is no longer our private business. It's mandated by the DRM FourCC. An external producer writes honest RGBA bytes into the buffer. Then our sampler, still convinced the format is A8R8G8B8, reads them as BGRA. Red and blue swap. And on the way out, a transfer blit happily swaps data that was already correct. The optimization that made GPU-internal rendering clean made buffer sharing wrong.
  GPU-internal (closed loop):       dmabuf (loop broken):

  PE writes BGRA                    external producer writes RGBA
       |                                  |
  sampler reads as A8R8G8B8         sampler reads as A8R8G8B8
       |                                  |
  cancels out -> correct            reads RGBA as BGRA -> swapped
Step back out for shared resources
The first fix is the obvious one: when a resource is shared, don't play the trick. Use the native A8B8G8R8 texture format so the sampler reads RGBA bytes as RGBA, skip the R/B swizzle in the BLT and RS transfer blits, and re-enable the texture shadow shortcut that the swizzle had forced us to disable. Internal resources keep the BGRA-internal optimization untouched.
That handles imports. But there's a case it doesn't cover: a resource we rendered into and then export. The PE wrote BGRA, because that's all the PE knows how to do. The external consumer expects native order.
Here a second kind of shadow shows up. Just as the sampler gets a texture shadow when it can't read the base layout, the PE gets a render shadow - a render-compatible copy - when it can't draw into the base layout. (On some GPUs, like GC2000, no single tiling satisfies both the texture engine and the pixel engine, so a resource can end up carrying both shadows.) When an exported resource is flushed, that render shadow is resolved back to the base. So we hook etna_flush_resource() and do the R/B swap during that copy - using the BLT destination swizzle or the RS SWAP_RB bit. The swap rides along on a copy we were doing anyway.
One buffer, two byte orders
Now the same shared buffer can be in one of two states. Just imported, or just flushed for export? Native RGBA. Freshly rendered by the PE, not yet flushed? PE-internal BGRA. A static texture format chosen at sampler-view creation can't be right for both.
So the format choice becomes dynamic. A shared_native_order flag tracks which order the bytes are currently in, and the sampler-view format follows from it:
shared_native_order |
How you get there | Bytes in buffer | Sampler format |
|---|---|---|---|
true |
set on import, and again after flush_resource() swaps on export |
native RGBA | A8B8G8R8 (native) |
false |
cleared when the PE renders straight into the buffer with no render shadow, and no shader swap fixed up the bytes (see below) | PE-internal BGRA | A8R8G8B8 (the trick) |
Both texture paths - state-based and descriptor-based - pre-compute the native format variant at sampler-view creation, so picking the right one at emit time costs a single branch, not a per-frame format recompute.
The shader swap comes back
Which brings us to LINEAR_PE GPUs, and a twist I didn't see coming.
On these GPUs, a linear shared resource is render-compatible. There is no render shadow - the PE writes straight into the buffer that gets handed to the compositor. So after a draw, the buffer holds BGRA, and flush_resource() would have to issue a full-surface blit to swap it. That's real bandwidth, on every frame, that the old shadow-based path never paid.
There's a cheaper place to do the swap: in the shader, on the way out. Which is exactly the thing this whole series set out to delete.
So it comes back - but only for this one case, and done properly. A per-RT frag_rb_swap bitmask in the shader key drives a NIR lowering pass that swaps channels 0 and 2 on the fragment output. The original shader swap fell over on scalar outputs, because there was no .z to swizzle from. This one widens the output variable to vec4 first, padding the missing components with undef, then applies the swizzle with an adjusted writemask:
   /* Pad source to 4 components (undef for missing) */
   nir_def *padded = nir_pad_vec4(&b, src);

   /* Swap R and B channels */
   unsigned swiz[] = {2, 1, 0, 3};
That's the scalar rgb8_lowp_float crash from the top of this post - fixed, in the one path that now needs a shader swap at all.
Wiring it up is a check in etna_draw_vbo():
   if (VIV_FEATURE(screen, ETNA_FEATURE_LINEAR_PE)) {
      for (i = 0; i < pfb->nr_cbufs; i++) {
         struct etna_resource *rsc = etna_resource(pfb->cbufs[i].texture);
         if (rsc->shared && rsc->layout == ETNA_LAYOUT_LINEAR &&
             translate_pe_format_rb_swap(pfb->cbufs[i].format))
            key.frag_rb_swap |= (1 << i);
      }
   }
The bitmask is per-RT, so an MRT setup with a mix of shared and private targets does the right thing for each. And because the shader produced native bytes directly, shared_native_order stays true and flush_resource() skips its blit entirely.
The fixes for all of this live in a follow-up series, etnaviv: Fix dmabuf R/B byte order for PE_FORMAT_RB_SWAP formats.
So was removing the shader swap a mistake?
No - but it wasn't the whole answer either.
The shader swap was wrong as the universal solution. It cost a shader-key dimension, per-RT blend-color fixups, and it crashed on scalar outputs. The texture-format trick is genuinely better for the common case, where a resource lives and dies on the GPU.
What the dmabuf work showed is that there is no single right place to fix R/B order. There's a place that's cheapest for each path: the texture format for GPU-internal resources, a transfer-blit swap at the CPU boundary, a flush-time swap for exported render targets, and - for LINEAR_PE, where the PE writes straight into a shared buffer - the shader, after all. The trick isn't picking one. It's knowing which boundary you're standing on, and swapping there.
10 Jun 2026 12:00am GMT
08 Jun 2026
planet.freedesktop.org
Maira Canal: Bringing Runtime Power Management to the Raspberry Pi GPU
As part of Igalia's collaboration with Raspberry Pi, I have previously blogged about several improvements we landed for the Broadcom VideoCore GPU (known as V3D), with the goal of extracting the best possible performance from the hardware. However, performance is not the whole story. On embedded devices, power consumption is just as important: reducing unnecessary activity helps lower heat generation, improve energy efficiency, and preserve performance over time by avoiding thermal throttling.
That is why, over the last few months, we have been working on adding Runtime Power Management support to the upstream V3D DRM driver, allowing the GPU to be powered and clocked according to its actual usage.
Why Runtime Power Management?
In the Linux kernel, Runtime Power Management (known as Runtime PM) is the mechanism that allows individual devices to be suspended and resumed dynamically while the system as a whole remains running. Instead of keeping a device fully powered all the time, the kernel can put the device into a low-power state when it is idle and bring it back when it is needed again.
In the graphics context, it is easy to see why runtime PM can be useful. A GPU is not necessarily active all the time: it may be heavily used while rendering a scene, but remain idle for long periods afterwards. If the driver keeps the GPU clocked during those idle periods, the system keeps spending energy on a block that is not doing useful work at all.
For embedded platforms, this is even more pressing. Reducing unnecessary power consumption helps decrease heat generation and improve overall energy efficiency. Even if the board is not battery-powered, avoiding needless power usage can reduce the need for cooling and leave more thermal budget available for other blocks.
The Problem: an idle GPU with an enabled clock
Until now, the V3D driver had a very simple power model: the GPU clock was enabled during probe and remained enabled for the entire lifetime of the driver. In practice, this meant that once the driver was loaded, the V3D clock stayed on until the driver was removed, regardless of whether the GPU was actively executing jobs. This was simple and functional, but it meant that an idle GPU was not idle from a power-management point of view.
On Raspberry Pi platforms, this is easy to observe with vcgencmd. Even with no GPU workload running, the V3D clock would still report an enabled frequency:
$ vcgencmd measure_clock v3d
frequency(0)=960016128
If the GPU is idle, the driver should be able to let the hardware become idle as well. Runtime PM provides the kernel infrastructure for that, but enabling it in the V3D driver required a bit more than simply adding suspend and resume callbacks.
Making the Raspberry Pi firmware clocks obey
At first glance, adding Runtime PM to V3D might look like a driver-local change, but in practice, things were a bit more subtle.
On Raspberry Pi platforms, some clocks are managed by the Raspberry Pi firmware. From the V3D driver's point of view, this is supposed to be mostly transparent: the driver uses the standard Linux clock framework, and the clock provider takes care of talking to the firmware underneath. However, this abstraction only works if calls to clk_prepare_enable() and clk_disable_unprepare() are translated into actual firmware requests to enable and disable the clock.
Surprisingly, that was not happening. The Raspberry Pi firmware clock driver did not implement the prepare/unprepare hooks, so these calls did not actually ask the firmware to enable or disable the clock. We fixed that by translating the common clock framework operations into the corresponding Raspberry Pi firmware commands [1][2][3].
However, there was still one firmware-specific caveat: on current firmware versions, RPI_FIRMWARE_SET_CLOCK_STATE does not fully power off the clock as expected. To work around this limitation and achieve meaningful power savings, the clock rate also needs to be set to the minimum before disabling the clock. This behavior may change in future firmware releases, but for now the clock driver needs to account for it explicitly.
With the firmware clock limitation addressed, the V3D driver could start relying on the usual kernel clock APIs as part of its Runtime PM flow. The next step was to reorganize the driver so that powering the GPU up and down became part of its operation.
Introducing Runtime PM to V3D
With the clock side behaving as expected, we could move the V3D driver itself to a Runtime PM model [7][8][9].
This required a small refactor of the probe path to separate power-independent setup from GPU-powered initialization. Resources that do not require the GPU to be powered are allocated during probe, while any initialization that depends on the GPU being clocked is handled during runtime resume. Runtime suspend then disables the clock again when the device becomes idle. The resulting flow is simple:
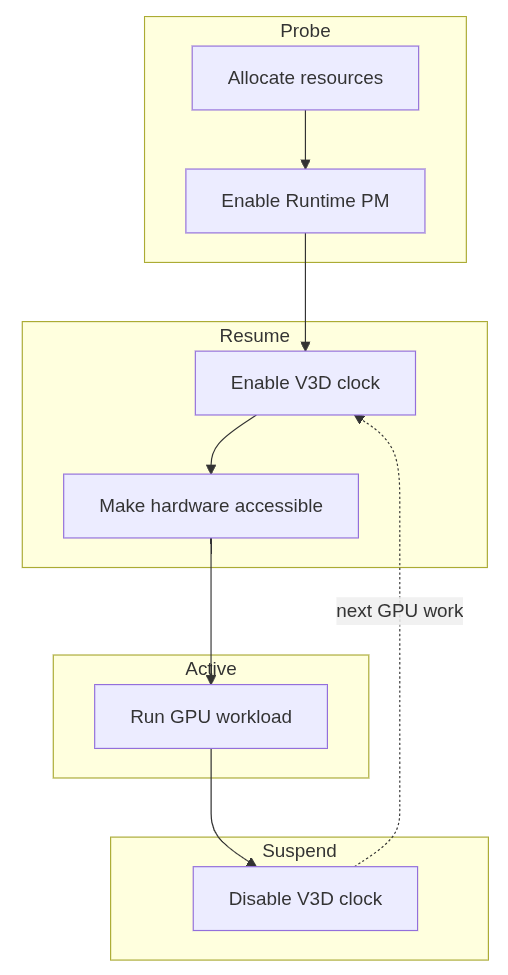
With that in place, the change becomes visible from userspace. While a GPU workload such as glmark2 is running, the V3D clock is enabled:
$ vcgencmd measure_clock v3d
frequency(0)=960016128
After the workload finishes and the GPU becomes idle, the clock can drop back to zero:
$ vcgencmd measure_clock v3d
frequency(0)=0
This is the behavior we wanted: the GPU remains available when there is work to do, but it no longer keeps its clock enabled while idle.
Results
To evaluate the effect of Runtime PM, we measured the board's power consumption with an external power meter in three scenarios: an idle desktop session with labwc running, an idle system without the compositor, and a full glmark2 run. Each condition was sampled at 100 Hz for around 300 seconds.
The first case represents a mostly idle graphical session, where labwc, the compositor used by Raspberry Pi OS, may still wake the GPU occasionally. The second is a baseline with no graphical workload, while the third is a sustained GPU benchmark intended to keep the GPU active.
The numbers behave the way one would hope. When the GPU is genuinely idle, the clock can be gated off and the savings show up as a clear drop: average draw falls from 3.30 W to 3.19 W with labwc running, and from 3.18 W to 3.09 W with no compositor at all. Both idle scenarios end up with savings of about 0.1 W (around 3%). Under glmark2, where the GPU is doing useful work for most of the run, the difference shrinks to about 0.015 W (0.3%), which is expected, as Runtime PM mainly affects the periods where the GPU becomes idle.
| Scenario | Before | After | Difference |
|---|---|---|---|
| Idle, compositor running | 3.300 W | 3.192 W | -0.108 W (-3.3%) |
| Idle, no compositor | 3.179 W | 3.093 W | -0.086 W (-2.7%) |
glmark2 full run |
5.698 W | 5.683 W | -0.015 W (-0.3%) |
The distribution of idle samples with labwc running also shows the effect clearly. With Runtime PM enabled, the distribution shifts toward lower power states. This indicates that the board spends more time in lower-power idle states once the V3D clock is no longer kept enabled unnecessarily.
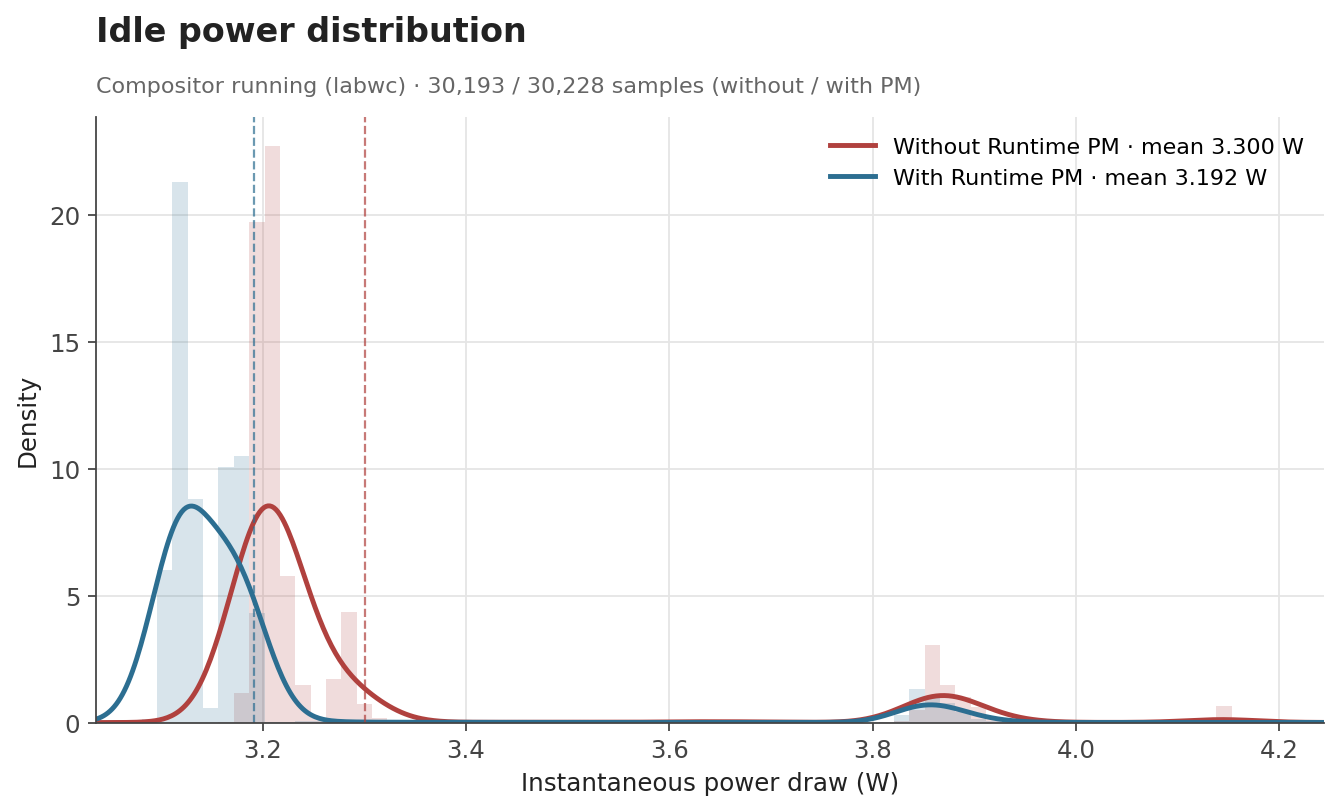
The effect is even cleaner with no compositor running. The samples collapse into two very narrow peaks with no overlap between them: without Runtime PM, the board sits at a stable 3.18 W; with Runtime PM, it sits at a stable 3.09 W.
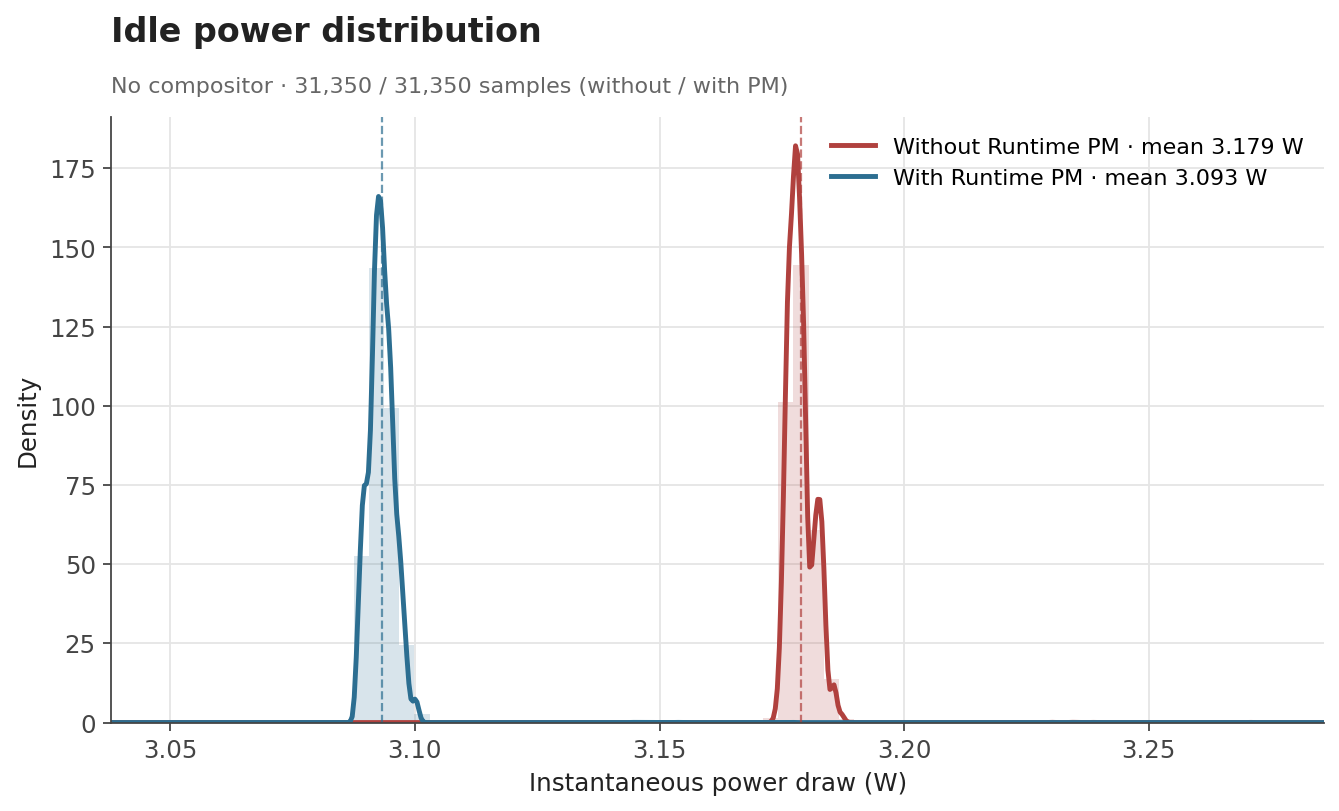
For glmark2, the time-series data shows that both configurations follow the same general workload pattern. Runtime PM does not significantly change the power profile while the GPU is busy, which is the intended behavior. The benefit appears when the workload leaves idle gaps or finishes, allowing the clock to be disabled again.
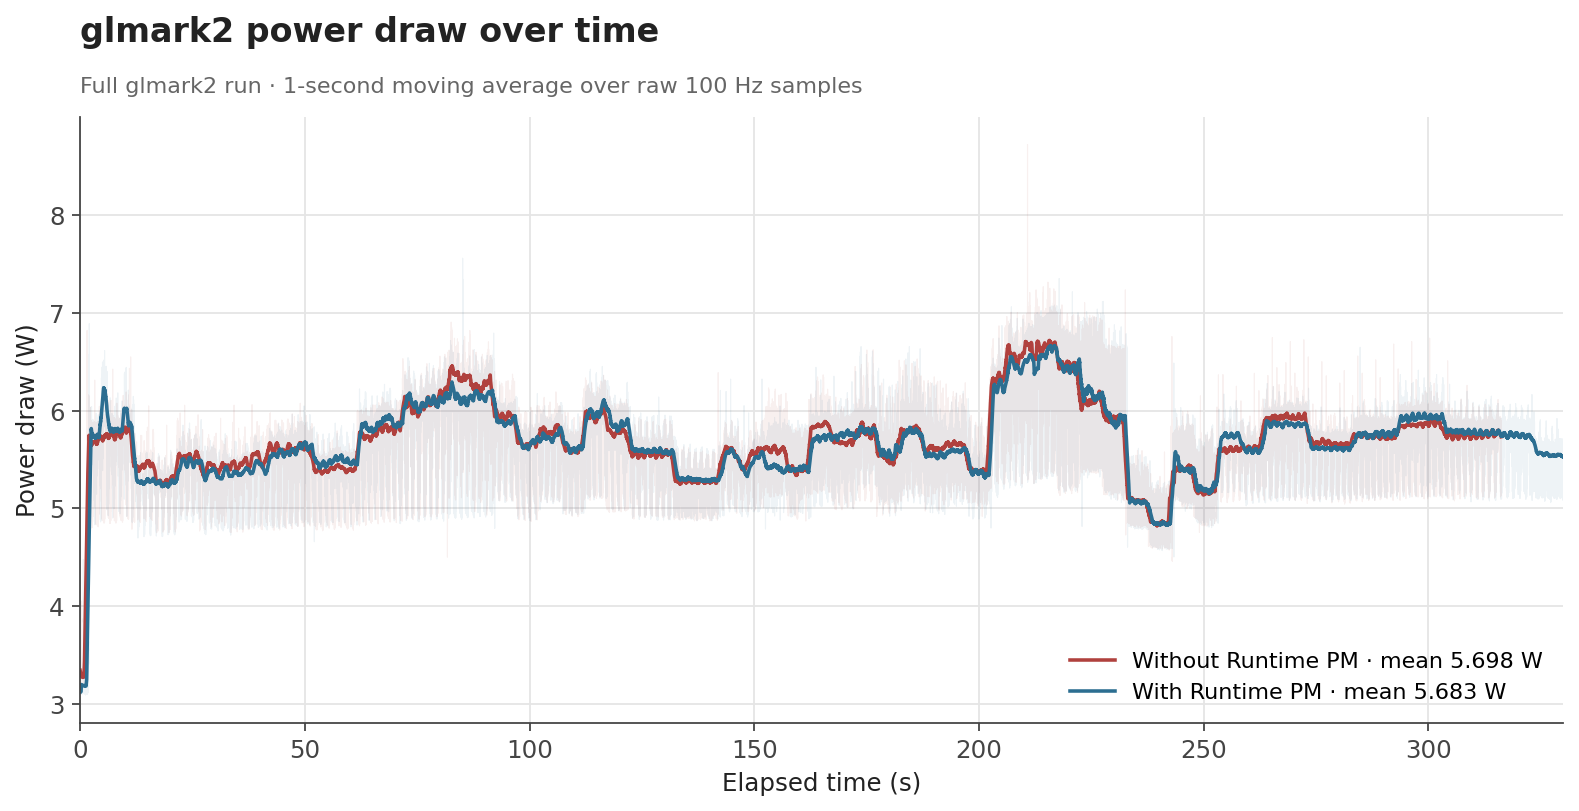
Overall, these measurements show that Runtime PM reduces power consumption where it matters most: when the GPU is idle. The absolute savings are modest at the board level, since the measurement includes the whole Raspberry Pi rather than the GPU power block alone, but the reduction is consistent with the intended change. The V3D clock no longer remains enabled for the full lifetime of the driver, and that translates into measurable reductions in idle power consumption.
Conclusion
Runtime PM support for V3D is one of those changes that is easy to overlook when everything is working correctly: userspace does not need to do anything differently, applications keep using the GPU as before, and the improvement happens underneath, in the way the kernel manages the hardware.
Beyond improving raw GPU performance, our work at Igalia is also about making the upstream graphics stack behave better as a system: more efficient when idle, more robust across firmware interfaces, and better aligned with the expectations of the Linux kernel infrastructure.
References
[2] clk: bcm: rpi: Maximize V3D clock - kernel/git/torvalds/linux.git - Linux kernel source tree
08 Jun 2026 3:30pm GMT
04 Jun 2026
planet.freedesktop.org
Dave Airlie (blogspot): Appearing on the Software Engineering Radio Podcast
Software Engineering Radio is a podcast for people in IT/development with over 700 episodes across many topics over 20 years. They haven't touched on the Linux kernel much. I was invited on as part of my role at Red Hat as a Distinguished Engineer, but the podcast is really an insight into kernel maintenance, in graphics and beyond, touching on the scope and scale of the project.
It was my first time to record something that wasn't just me talking at a conference/meetup, and it was all very professional, with sound checks and brainstorming before hand.
The content is at a pretty broad and introductory level. We talked about kernel development processes, maintenance processes, and we touch on rust in the kernel a bit. It's mostly about the sheer size and scale of the project and how Linus releases things, how trees get to Linus and how the GPU work is done.
Hopefully you enjoy listening to it!
[1] https://se-radio.net/2026/06/se-radio-723-dave-airlie-on-linux-kernel-maintenance/
04 Jun 2026 12:05am GMT
18 May 2026
planet.freedesktop.org
Tollef Fog Heen: Signing UEFI submissions using osslsigncode
Back when we started with a signed shim in Debian, the tooling was Windows-only and required me to do a reboot dance and it was all quite tedious. Over time, more and more of the tooling has migrated to Linux and it all works quite well.
The signing is done with an EV code signing cert from SSL.com and stored on a Yubikey. Getting the certificate onto the key is a bit tedious, but reasonably well-explained in the ssl.com docs.
Microsoft wants the shim binaries uploaded to their partner portal wrapped in a .cab file, which should be signed.
The wrapping in a .cab file is easy enough: lcab shim.efi shim-unsigned.cab. It's fine to put shims for multiple architectures in the same .cab file.
Signing of the file is a little bit of a rune:
osslsigncode sign -pkcs11module /usr/lib/x86_64-linux-gnu/libykcs11.so -key "pkcs11:serial=XXX" -askpass -certs chain.crt -h sha256 -ts http://ts.ssl.com shim-unsigned.cab shim-unsigned.signed.cab
chain.crt contains first our EV code signing cert, then the ssl.com intermediate EV code signing cert, then the ssl.com EV root cert. The naming of the packages is a tiny bit confusing, but it's because the package name in Debian is shim-unsigned.
Occasionally, processing of uploaded binaries just stops in the validation stage in the portal, but I've so far been able to unstuck them by re-signing and uploading again, and I saw the same with the MS/Windows toolchain, so I suspect it's just flakiness on the portal side.
18 May 2026 6:50pm GMT
23 Apr 2026
planet.freedesktop.org
Sebastian Wick: How Hard Is It To Open a File?
It's a question I had to ask myself multiple times over the last few months. Depending on the context the answer can be:
- very simple, just call the standard library function
- extremely hard, don't trust anything
If you are an app developer, you're lucky and it's almost always the first answer. If you develop something with a security boundary which involves files in any way, the correct answer is very likely the second one.
Opening a File, the Hard Way
Like so often, the details depend on the specifics, but in the worst-case scenario, there is a process on either side of the security boundary, which operate on a filesystem tree which is shared by both processes.
Let's say that the process with more privileges operates on a file on behalf of the process with less privileges. You might want to restrict this to files in a certain directory, to prevent the less privileged process from, for example, stealing your SSH key, and thus take a subpath that is relative to that directory.
The first obvious problem is that the subpath can refer to files outside of the directory if it contains ... If the privileged process gets called with a subpath of ../.ssh/id_ed25519, you are in trouble. Easy fix: normalize the path, and if we ever go outside of the directory, fail.
The next issue is that every component of the path might be a symlink. If the privileged process gets called with a subpath of link, and link is a symlink to ../.ssh/id_ed25519, you might be in trouble. If the process with less privileges cannot create files in that part of the tree, it cannot create a malicious symlink, and everything is fine. In all other scenarios, nothing is fine. Easy fix: resolve the symlinks, expand the path, then normalize it.
This is usually where most people think we're done, opening a file is not that hard after all, we can all do more fun things now. Really, this is where the fun begins.
The fix above works, as long as the less privileged process cannot change the file system tree anywhere in the file's path while the more privileged process tries to access it. Usually this is the case if you unpack an attacker-provided archive into a directory the attacker does not have access to. If it can however, we have a classic TOCTOU (time-of-check to time-of-use) race.
We have the path foo/id_ed25519, we resolve the smlinks, we expand the path, we normalize it, and while we did all of that, the other process just replaced the regular directory foo that we just checked with a symlink which points to ../.ssh. We just checked that the path resolves to a path inside the target directory though, and happily open the path foo/id_ed25519 which now points to your ssh key. Not an easy fix.
So, what is the fundamental issue here? A path string like /home/user/.local/share/flatpak/app/org.example.App/deploy describes a location in a filesystem namespace. It is not a reference to a file. By the time you finish speaking the path aloud, the thing it names may have changed.
The safe primitive is the file descriptor. Once you have an fd pointing at an inode, the kernel pins that inode. The directory can be unlinked, renamed, or replaced with a symlink; the fd does not care. A common misconception is that file descriptors represent open files. It is true that they can do that, but fds opened with O_PATH do not require opening the file, but still provide a stable reference to an inode.
The lesson that should be learned here is that you should not call any privileged process with a path. Period. Passing in file descriptors also has the benefit that they serve as proof that the calling process actually has access to the resource.
Another important lesson is that dropping down from a file descriptor to a path makes everything racy again. For example, let's say that we want to bind mount something based on a file descriptor, and we only have the traditional mount API, so we convert the fd to a path, and pass that to mount. Unfortunately for the user, the kernel resolves the symlinks in the path that an attacker might have managed to place there. Sometimes it's possible to detect the issue after the fact, for example by checking that the inode and device of the mounted file and the file descriptor match.
With that being said, sometimes it is not entirely avoidable to use paths, so let's also look into that as well!
In the scenario above, we have a directory in which we want all the paths to resolve in, and that the attacker does not control. We can thus open it with O_PATH and get a file descriptor for it without the attacker being able to redirect it somewhere else.
With the openat syscall, we can open a path relative to the fd we just opened. It has all the same issues we discussed above, except that we can also pass O_NOFOLLOW. With that flag set, if the last segment of the path is a symlink, it does not follow it and instead opens the actual symlink inode. All the other components can still be symlinks, and they still will be followed. We can however just split up the path, and open the next file descriptor for the next path segment and resolve symlinks manually until we have done so for the entire path.
libglnx chase
libglnx is a utility library for GNOME C projects that provides fd-based filesystem operations as its primary API. Functions like glnx_openat_rdonly, glnx_file_replace_contents_at, and glnx_tmpfile_link_at all take directory fds and operate relative to them. The library is built around the discipline of "always have an fd, never use an absolute path when you can use an fd."
The most recent addition is glnx_chaseat, which provides safe path traversal, and was inspired by systemd's chase(), and does precisely what was described above.
int glnx_chaseat (int              dirfd,
                  const char      *path,
                  GlnxChaseFlags   flags,
                  GError         **error);
It returns an O_PATH | O_CLOEXEC fd for the resolved path, or -1 on error. The real magic is in the flags:
typedef enum _GlnxChaseFlags {
  /* Default */
  GLNX_CHASE_DEFAULT = 0,
  /* Disable triggering of automounts */
  GLNX_CHASE_NO_AUTOMOUNT = 1 << 1,
  /* Do not follow the path's right-most component. When the path's right-most
   * component refers to symlink, return O_PATH fd of the symlink. */
  GLNX_CHASE_NOFOLLOW = 1 << 2,
  /* Do not permit the path resolution to succeed if any component of the
   * resolution is not a descendant of the directory indicated by dirfd. */
  GLNX_CHASE_RESOLVE_BENEATH = 1 << 3,
  /* Symlinks are resolved relative to the given dirfd instead of root. */
  GLNX_CHASE_RESOLVE_IN_ROOT = 1 << 4,
  /* Fail if any symlink is encountered. */
  GLNX_CHASE_RESOLVE_NO_SYMLINKS = 1 << 5,
  /* Fail if the path's right-most component is not a regular file */
  GLNX_CHASE_MUST_BE_REGULAR = 1 << 6,
  /* Fail if the path's right-most component is not a directory */
  GLNX_CHASE_MUST_BE_DIRECTORY = 1 << 7,
  /* Fail if the path's right-most component is not a socket */
  GLNX_CHASE_MUST_BE_SOCKET = 1 << 8,
} GlnxChaseFlags;
While it doesn't sound too complicated to implement, a lot of details are quite hairy. The implementation uses openat2, open_tree and openat depending on what is available and what behavior was requested, it handles auto-mount behavior, ensures that previously visited paths have not changed, and a few other things.
An Aside on Standard Libraries
The POSIX APIs are not great at dealing with the issue. The GLib/Gio APIs (GFile, etc.) are even worse and only accept paths. Granted, they also serve as a cross-platform abstraction where file descriptors are not a universal concept. Unfortunately, Rust also has this cross-platform abstraction which is based entirely on paths.
If you use any of those APIs, you very likely created a vulnerability. The deeper issue is that those path-based APIs are often the standard way to interact with files. This makes it impossible to reason about the security of composed code. You can audit your own code meticulously, open everything with O_PATH | O_NOFOLLOW, chain *at() calls carefully - and then call a third-party library that calls open(path) internally. The security property you established in your code does not compose through that library call.
This means that any system-level code that cares about filesystem security has to audit all transitive dependencies or avoid them in the first place.
So what would a better GLib cross-platform API look like? I would say not too different from chaseat(), but returning opaque handles instead of file descriptors, which on Unix would carry the O_PATH file descriptor and a path that can be used for printing, debugging and things like that. You would open files from those handles, which would yield another kind of opaque handle for reading, writing, and so on.
The current GFile was also designed to implement GVfs: g_file_new_for_uri("smb://server/share/file") gives you a GFile you can g_file_read() just like a local file. This is the right goal, but the wrong abstraction layer. Instead, this kind of access should be provided by FUSE, and the URI should be translated to a path on a specific FUSE mount. This would provide a few benefits:
- The fd-chasing approach works everywhere because it is a real filesystem managed by the kernel
- The filesystem becomes independent of GLib and can be used for example from Rust as well
- It stacks with other FUSE filesystems, such as the XDG Desktop Document Portal used by Flatpak
Wait, Why Are You Talking About This?
Nowadays I maintain a small project called Flatpak. Codean Labs recently did a security analysis on it and found a number of issues. Even though Flatpak developers were aware of the dangers of filesystems, and created libglnx because of it, most of the discovered issues were just about that. One of them (CVE-2026-34078) was a complete sandbox escape.
flatpak run was designed as a command-line tool for trusted users. When you type flatpak run org.example.App, you control the arguments. The code that processes the arguments was written assuming the caller is legitimate. It accepted path strings, because that's what command-line tools accept.
The Flatpak portal was then built as a D-Bus service that sandboxed apps could call to start subsandboxes - and it did this by effectively constructing a flatpak run invocation and executing it. This connected a component designed for trusted input directly to an untrusted caller (the sandboxed app).
Once that connection exists, every assumption baked into flatpak run about caller trustworthiness becomes a potential vulnerability. The fix wasn't "change one function" - it was "audit the entire call chain from portal request to bubblewrap execution and replace every path string with an fd." That's commits touching the portal, flatpak-run, flatpak_run_app, flatpak_run_setup_base_argv, and the bwrap argument construction, plus new options (--app-fd, --usr-fd, --bind-fd, --ro-bind-fd) threaded through all of them.
If the GLib standard file and path APIs were secure, we would not have had this issue.
Another annoyance here is that the entire subsandboxing approach in Flatpak comes from 15 years ago, when unprivileged user namespaces were not common. Nowadays we could (and should) let apps use kernel-native unprivileged user namespaces to create their own subsandboxes.
Unfortunately with rather large changes comes a high likelihood of something going wrong. For a few days we scrambled to fix a few regressions that prevented Steam, WebKit, and Chromium-based apps from launching. Huge thanks to Simon McVittie!
In the end, we managed to fix everything, made Flatpak more secure, the ecosystem is now better equipped to handle this class of issues, and hopefully you learned something as well.
23 Apr 2026 8:41pm GMT