14 Jul 2026
 Kubernetes Blog
Building a Custom Metrics Exporter for Kubernetes
Kubernetes ships with built-in awareness of CPU and memory, but most real-world scaling decisions depend on signals that live entirely outside that narrow window: how many messages are waiting in a queue, how long the last batch job took, how many active WebSocket connections a pod is holding. When the built-in metrics are not enough, a metrics exporter bridges that gap.
This post walks through writing one from scratch, packaging it as a container, and wiring it into a cluster so that Prometheus - and ultimately the HorizontalPodAutoscaler - can consume it.
What a metrics exporter actually does
An exporter is a small HTTP server with a single responsibility: expose application state as text on a /metrics endpoint. Prometheus scrapes that endpoint on a regular interval, stores the time-series data, and makes it available for queries, alerts, and autoscaling rules.
In some cases you can instrument your application directly - embedding the Prometheus client library and exposing /metrics from within the same process - rather than running a separate exporter. A standalone exporter makes more sense when the data source is external to your application or when you do not control the application code.
The format Prometheus expects is plain text - one metric per line, with a name, optional labels, and a numeric value. Client libraries handle the serialization for you, so in practice you only need to decide what to measure and call the right function when that value changes.
Choosing what to measure
Before writing any code, it helps to decide what kind of signal you are dealing with. The Prometheus data model has three main types:
-
Counters only ever increase. They are the right tool for totals: requests served, jobs processed, errors encountered. Never use a counter for a value that can go down.
-
Gauges represent a current snapshot of a value that can rise and fall freely. Queue depth, active connections, and cache size are all gauges.
-
Histograms record the distribution of observed values, such as request latency. They let you calculate percentiles (p99, p50) rather than just averages.
Once you know which type fits your signal, choose a name that follows the convention <namespace>_<name>_<unit> in snake_case. A job processor might expose worker_jobs_processed_total (counter), worker_queue_depth (gauge), and worker_job_duration_seconds (histogram). Clear names save everyone debugging time later.
Setting up the project
The Go Prometheus client is the most common choice for exporters in the Kubernetes ecosystem, largely because the same library powers most of the official Kubernetes components. Start by creating a module and pulling in the dependency:
mkdir my-exporter && cd my-exporter
go mod init example.com/my-exporter
go get github.com/prometheus/client_golang/prometheus
go get github.com/prometheus/client_golang/prometheus/promhttp
Registering metrics
Create main.go. The first thing to do is declare the metrics and register them with Prometheus's default registry. Registration tells the library that these metrics exist so they appear in the output even before the first observation is recorded:
package main

import (
 "log"
 "net/http"

 "github.com/prometheus/client_golang/prometheus"
 "github.com/prometheus/client_golang/prometheus/promhttp"
)

var (
 jobsProcessed = prometheus.NewCounterVec(
 prometheus.CounterOpts{
 Name: "worker_jobs_processed_total",
 Help: "Total number of jobs processed, partitioned by status.",
 },
 []string{"status"},
 )

 queueDepth = prometheus.NewGauge(prometheus.GaugeOpts{
 Name: "worker_queue_depth",
 Help: "Current number of jobs waiting in the queue.",
 })

 jobDuration = prometheus.NewHistogram(prometheus.HistogramOpts{
 Name: "worker_job_duration_seconds",
 Help: "Time spent processing a single job.",
 Buckets: prometheus.DefBuckets,
 })
)

func init() {
 prometheus.MustRegister(jobsProcessed, queueDepth, jobDuration)
}
prometheus.MustRegister panics on a duplicate registration, which makes misconfigurations obvious at startup rather than silently at runtime. If you are embedding this exporter inside a library that other packages will also instrument, prefer prometheus.Register and handle the error yourself.
Collecting real values
With the metrics registered, the next step is to keep them current. You can either continually update the data as the data change, or run your own internal refresh loop. The pattern below shows a polling loop - a goroutine that periodically reads from whatever data source your application owns and updates the registered metrics. Replace the simulated values with real calls to your database, internal API, or message broker:
import (
 "math/rand"
 "time"
)

func collectMetrics() {
 for {
 // Replace these with real reads from your application.
 depth := float64(rand.Intn(50))
 queueDepth.Set(depth)

 start := time.Now()
 time.Sleep(time.Duration(rand.Intn(200)) * time.Millisecond)
 jobDuration.Observe(time.Since(start).Seconds())
 jobsProcessed.WithLabelValues("success").Inc()

 time.Sleep(5 * time.Second)
 }
}
The polling interval (here five seconds) should be shorter than Prometheus's scrape interval so that each scrape sees a fresh value. The default scrape interval in most cluster deployments is fifteen seconds, which gives you comfortable headroom.
Exposing the endpoint
Wire the collection loop and the HTTP handler together in main. A /healthz path alongside /metrics gives Kubernetes a liveness probe target without exposing metric data on the health route:
func main() {
 go collectMetrics()

 http.Handle("/metrics", promhttp.Handler())
 http.HandleFunc("/healthz", func(w http.ResponseWriter, r *http.Request) {
 w.WriteHeader(http.StatusOK)
 })

 log.Println("Listening on :8080")
 if err := http.ListenAndServe(":8080", nil); err != nil {
 log.Fatalf("server error: %v", err)
 }
}
Verify the output locally before building the image:
go run .
curl http://localhost:8080/metrics | grep worker_
You should see three # HELP and # TYPE blocks followed by the current metric values. If those lines appear, the exporter is working correctly and is ready to be containerized.
Build a container image
A multi-stage build keeps the final image small and avoids shipping a Go toolchain to production. The first stage compiles a statically linked binary; the second stage copies only that binary into a minimal base. The example below uses Docker, but the same pattern works with any OCI-compatible build tool such as Buildah or Podman:
FROM golang:1.21-alpine AS builder
WORKDIR /src
COPY go.mod go.sum ./
RUN go mod download
COPY . .
RUN CGO_ENABLED=0 go build -o /exporter .

FROM gcr.io/distroless/static:nonroot
COPY --from=builder /exporter /exporter
EXPOSE 8080
ENTRYPOINT ["/exporter"]
distroless/static:nonroot contains no shell, no package manager, and runs as a non-root user by default, which satisfies most cluster security policies without extra configuration.
Build and push the image, replacing <registry> with your own registry address:
docker build -t <registry>/my-exporter:v1.0.0 .
docker push <registry>/my-exporter:v1.0.0
(Note: Using a CI/CD pipeline to automate this is generally a better pattern than running these commands manually.)
Deploying to the cluster
Two manifests are enough to run the exporter: a Deployment that manages the pod lifecycle, and a Service that gives Prometheus a stable address to scrape. (You might prefer to have Prometheus scrape from every Pod; if that makes sense for your use case, then it's OK to configure instead).
The examples below use the monitoring namespace, which is a common convention when running Prometheus and related components together. Adjust the namespace to match your own cluster setup.
The Deployment sets conservative resource limits appropriate for a lightweight sidecar-style process, and uses the /healthz route for its liveness probe:
apiVersion: apps/v1
kind: Deployment
metadata:
 name: my-exporter
 namespace: monitoring
 labels:
 app.kubernetes.io/name: my-exporter
spec:
 replicas: 1
 selector:
 matchLabels:
 app.kubernetes.io/name: my-exporter
 template:
 metadata:
 labels:
 app.kubernetes.io/name: my-exporter
 spec:
 containers:
 - name: exporter
 image: <registry>/my-exporter:v1.0.0
 ports:
 - name: metrics
 containerPort: 8080
 livenessProbe:
 httpGet:
 path: /healthz
 port: 8080
 initialDelaySeconds: 5
 periodSeconds: 10
 resources:
 requests:
 cpu: 50m
 memory: 32Mi
 limits:
 cpu: 100m
 memory: 64Mi
The Service names the port metrics, which the ServiceMonitor in the next section will reference by that name:
apiVersion: v1
kind: Service
metadata:
 name: my-exporter
 namespace: monitoring
 labels:
 app.kubernetes.io/name: my-exporter
spec:
 selector:
 app.kubernetes.io/name: my-exporter
 ports:
 - name: metrics
 port: 8080
 targetPort: metrics
Apply both:
kubectl apply -f deployment.yaml -f service.yaml
Telling Prometheus where to look
How you configure scraping depends on how Prometheus was installed.
Option 1: Prometheus Operator (ServiceMonitor)
If you installed Prometheus using the Prometheus Operator or the kube-prometheus-stack Helm chart, the operator must be running in your cluster before you create a ServiceMonitor. The release label must match the label selector configured on your Prometheus resource - kube-prometheus-stack is the default for a standard Helm install:
apiVersion: monitoring.coreos.com/v1
kind: ServiceMonitor
metadata:
 name: my-exporter
 namespace: monitoring
 labels:
 release: kube-prometheus-stack
spec:
 selector:
 matchLabels:
 app.kubernetes.io/name: my-exporter
 endpoints:
 - port: metrics
 interval: 15s
 path: /metrics
Option 2: Annotation-based discovery
If your Prometheus uses annotation-based pod discovery instead, you will need a matching scrape_config rule in your Prometheus configuration - check with whoever manages your Prometheus installation to confirm it is in place.
You can add the following two annotations to the Pod template regardless of which scraping method you use. They are ignored by the Prometheus Operator but picked up automatically by annotation-based setups:
annotations:
 prometheus.io/scrape: "true"
 prometheus.io/port: "8080" # omit if not using annotation-based discovery
 prometheus.io/path: "/metrics" # omit if not using annotation-based discovery
If you are unsure which setup your cluster uses, the ServiceMonitor approach is more explicit and easier to debug.
Verifying the scrape
Port-forward to the Prometheus service and open the targets page to confirm the exporter has been discovered:
kubectl port-forward svc/prometheus-operated 9090 -n monitoring
Navigate to http://localhost:9090/targets. The my-exporter target should appear with state UP. If it shows DOWN, check that the ServiceMonitor's release label matches and that the pod is running:
kubectl get pods -n monitoring -l app.kubernetes.io/name=my-exporter
kubectl describe servicemonitor my-exporter -n monitoring
Once the target is healthy, run a quick query in the expression browser to confirm data is flowing:
rate(worker_jobs_processed_total{status="success"}[2m])
A non-zero result here means the full pipeline is working: your application is producing data, Prometheus is scraping it, and the time-series are stored and queryable.
What comes next
A working exporter is the foundation, not the destination. The natural next step is surfacing these metrics to the HorizontalPodAutoscaler so that your workload scales on the signals that actually drive load, not just CPU. That requires a metrics adapter - the Prometheus Adapter is the most widely deployed option - which registers your custom metrics with the Kubernetes Custom Metrics API. Once registered, any HorizontalPodAutoscaler in the cluster can reference worker_queue_depth or worker_jobs_processed_total directly in its metrics block.
For a walkthrough of that setup, see Autoscaling on multiple metrics and custom metrics. For a catalog of ready-made exporters covering databases, message brokers, and cloud services, the Prometheus exporters and integrations page is a good starting point.
14 Jul 2026 6:00pm GMT
13 Jul 2026
Kubernetes Blog
Operating AI/ML Workloads on Kubernetes: A Headlamp Plugin for Kubeflow
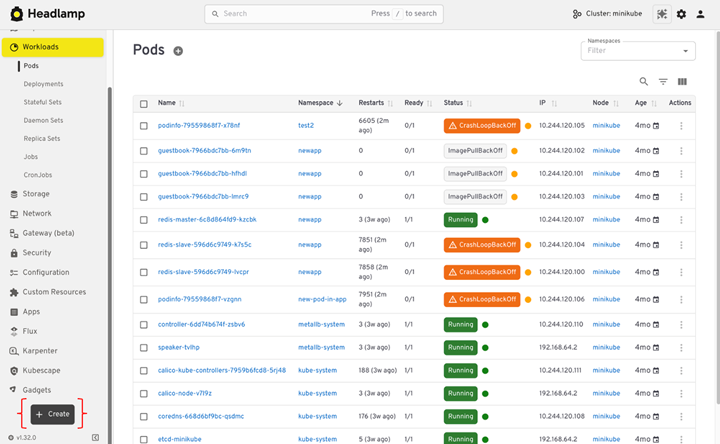
Kubernetes has quietly become the default platform for AI and machine learning. Whether you run notebook servers for data scientists, schedule distributed training jobs, tune hyperparameters, or orchestrate multi-step ML pipelines, those workloads increasingly land on a Kubernetes cluster. Kubeflow is one of the most popular ways to assemble that stack, and it does so the Kubernetes-native way: every capability is exposed as a Custom Resource Definition (CRD).
That design is a gift to cluster operators, because it means ML workloads can be observed and managed with the same primitives as everything else in the cluster. But in practice the specialized ML dashboards that ship with these platforms hide the Kubernetes layer underneath. When a notebook is stuck or a training run fails, the operator is often left dropping back to kubectl to find out what actually happened at the Pod level.
This post introduces the Headlamp Kubeflow plugin, which closes that gap by surfacing Kubeflow's custom resources directly inside a general-purpose Kubernetes UI. It is a worked example of a pattern any CRD-heavy platform can follow: meet operators where they already work, and show them the cluster-level truth.
Headlamp itself is an extensible Kubernetes web UI maintained under Kubernetes SIG UI and licensed under Apache 2.0. It runs as a desktop app or in-cluster, and its plugin system lets anyone add first-class views for custom resources.
Why operators need a different view
Purpose-built ML dashboards help data scientists submit experiments, pipelines, and notebooks. Cluster operators and site reliability engineers (SREs) troubleshoot the Kubernetes resources underneath, and they ask different questions:
- Why is a notebook stuck? Is it
ImagePullBackOff,OOMKilled, or a Pod waiting on a PersistentVolumeClaim? - Which Run resources failed recently across namespaces?
- Which parameter set does a Katib Experiment report as optimal?
- Do TrainJob resources reference the expected TrainingRuntime resources?
- Which batch workloads are running, and what state does Kubernetes report?
The Headlamp Kubeflow plugin helps answer these questions by reading directly from the Kubernetes API server. It shows Pod conditions, Kubernetes failure reasons, and resources across namespaces without requiring an intermediary ML service or database.
What the plugin covers
Kubeflow is modular, and teams often install only the components they need. The plugin discovers the Kubeflow API groups on a cluster and displays only the corresponding sections.
The plugin supports the following component families and API resources:
| Component | Purpose | API resources |
|---|---|---|
| Notebooks | Provides development environments such as Jupyter, VS Code, and RStudio | Notebook, Profile, PodDefault |
| Pipelines | Defines and tracks pipelines, versions, experiments, runs, and schedules | Pipeline, PipelineVersion, Run, RecurringRun, Experiment |
| Katib | Automates hyperparameter tuning and neural architecture search | Experiment, Trial, Suggestion |
| Training | Runs distributed training workloads such as PyTorch and TensorFlow jobs | TrainJob, TrainingRuntime, ClusterTrainingRuntime |
| Spark | Runs large-scale data processing with Apache Spark | SparkApplication, ScheduledSparkApplication |
What you can see
Inspect notebook Pods
The Notebook detail view shows Pod conditions and their reason and message fields. It also shows CPU, memory, and GPU requests and limits; volume mounts and their backing types, such as PersistentVolumeClaim, ConfigMap, Secret, or emptyDir; environment variables that reference Secret or ConfigMap objects; sidecar containers; and node tolerations. This view consolidates information that would otherwise require several kubectl describe commands.
Inspect hyperparameter tuning
The Katib views show the tuning algorithm, search space, every Trial with its live status, and the current best Trial with its metric values and parameter assignments. They also show the early-stopping configuration and the number of Trial resources that stopped early, so you can follow the search without leaving the cluster UI.
Inspect pipeline state without the backend database
The Pipelines views read Kubernetes API resources directly and do not query the Kubeflow Pipelines API service or backend database. You can inspect stored pipeline state even when that service is unavailable. The Pipeline detail view compares the latest and previous PipelineVersion specifications in a side-by-side YAML diff. Run views show state and duration, RecurringRun views show human-readable schedules, and the artifacts view aggregates pipelineRoot values from recent Run resources.
Map ML resources
The plugin registers a Headlamp map source that renders Notebook, Profile, PodDefault, Experiment, Pipeline, SparkApplication, and TrainJob resources as graph nodes. It draws edges between supported resources based on .metadata.ownerReferences. Headlamp also shows inline summaries for these resource types when you hover over them.
Try it
The Kubeflow plugin README explains installation and local-cluster setup, including a lightweight CRD-only path for evaluation. Because the plugin discovers installed API groups, you can use it with an existing modular Kubeflow installation or create an evaluation cluster with only the CRDs and sample resources.
Apply the pattern to other platforms
Kubeflow illustrates a broader pattern. Platforms often model domain-specific workflows with custom resources. Their dashboards focus on those workflows, while Kubernetes operators also need the state of the underlying API resources and Pods. A CRD-driven plugin in a general Kubernetes UI can expose that state without making operators switch between unrelated tools.
The plugin uses the Apache 2.0 license and is developed under Kubernetes SIG UI. To report a problem or contribute an improvement, use the Headlamp plugins repository's issue tracker or pull requests.
13 Jul 2026 8:00pm GMT
Kubernetes Dashboard to Headlamp: A Step-by-Step Guide
1. Before you start: know what is changing
Kubernetes Dashboard and Headlamp both show what is running in a cluster, but they work differently. When Headlamp runs on the desktop, it uses your existing kubeconfig to connect to one or more clusters and can be extended with plugins. When Headlamp runs inside a cluster, it uses a Kubernetes ServiceAccount to access the API and follow RBAC rules. Kubernetes Dashboard, in contrast, only runs in-cluster and always relies on service account tokens. Understanding these models early helps you choose the right setup and permissions.
1.1 How Kubernetes Dashboard works
Dashboard is a web app that runs inside your cluster.
- You install it in the cluster, often with Helm.
- You usually run one Dashboard per cluster.
- You often reach it with
kubectl port-forwardor an ingress. - You log in with a Bearer token. That token is often from a service account.
- It includes forms that help you create resources.
- It leans on tables and lists for navigation.
It feels like this: a UI that lives with the cluster.
1.2 How Headlamp works
Headlamp acts more like a Kubernetes client with a UI.
- It can run on your desktop or in a cluster.
- It reads your kubeconfig, like kubectl does.
- It can show more than one cluster in one place.
- It favors YAML when you create or change resources.
- It includes list views and a visual map.
- You can add features with plugins.
Headlamp is a UI that follows your identity, not your cluster.
1.3 What stays the same
Many workflows will feel familiar:
- Browse workloads and resources
- Filter by namespace
- Inspect YAML, events, and status
- View logs
- Take actions your RBAC allows
1.4 What changes
A few things will feel different:
- Login shifts from pasted tokens to kubeconfig (and sometimes SSO).
- Creation shifts from forms to "apply YAML."
- Multi-cluster becomes normal, not a special case.
- The map view helps you see how resources connect.
2. Pre-migration checklist
This checklist helps you avoid surprises during the switch. It makes sure Headlamp can use the same identity and permissions you already trust in Kubernetes. It also gives you a quick way to prove the migration worked before you turn off Dashboard.
2.1 Write down what you use today
List the basics:
- Which clusters you use (dev, staging, prod)
- Which namespaces you touch most
- What you do most often (view, edit, scale, delete, debug)
- How you access Dashboard today (port-forward or ingress)
- How you log in (service account token, and which RBAC bindings)
This is your baseline.
2.2 Check that kubeconfig works
Headlamp uses kubeconfig, especially on desktop. Make sure yours works before you install anything.
Run:
kubectl config current-context
Then try:
kubectl get nodes
If you cannot list nodes, test in a namespace you can access:
kubectl get pods -n <namespace>
If these work, Headlamp can use the same identity and RBAC.
2.3 Pick a rollout plan
There is no need to rush. Most teams choose one of these:
Parallel rollout (recommended)
- Install Headlamp
- Let people try it
- Keep Dashboard for a short time
- Remove Dashboard after the team is ready
Cutover
- Install Headlamp
- Switch docs and links
- Remove Dashboard soon after
Parallel rollout is safer for shared clusters.
2.4 Decide where Headlamp will run
You can use either option. Many teams use both.
Desktop
- Uses your kubeconfig
- Uses no cluster resources
- No port-forward needed
- Multi-cluster works out of the box
In-cluster
- Works well for shared, browser access
- Can be managed like other cluster apps
- Often paired with ingress and SSO
2.5 Note optional dependencies
These are common. You can handle them later.
metrics-server(for CPU and memory graphs)- ingress (for an in-cluster URL)
- OIDC / SSO (for browser sign-in)
- cleanup of old Dashboard service accounts and RBAC
3. Choose where Headlamp will run (desktop or in-cluster)
Headlamp can run on your desktop or inside a cluster. Both work well, but they fit different needs. Desktop is the fastest way to start because it uses your kubeconfig and does not run in the cluster. In-cluster is best when you need a shared URL and want the platform team to manage upgrades and access.
Option A: Desktop (user-managed)
Desktop Headlamp runs on each user's machine. It reads the same kubeconfig you use with kubectl. This keeps access tied to each user's identity and RBAC.
Why teams pick it
- No in-cluster service to deploy or expose.
- It uses no cluster CPU or memory.
- It uses your kubeconfig and RBAC.
- It works with many clusters in one app.
- You do not need port-forward for day-to-day use.
Option B: In-cluster (best for shared access)
In-cluster Headlamp is installed as a Kubernetes workload (often via Helm). This lets cluster admins manage it like other in-cluster apps.
- Cluster admins manage install, upgrades, and configuration through the Helm chart and standard Kubernetes tooling.
- Admins control ingress and can set up OIDC login for shared access.
- It supports shared use in team environments.
4. Install Headlamp (desktop and in-cluster)
This section gets Headlamp running. Follow the path you chose in Section 3.
4.1 Desktop install (fastest way to start)
Install Headlamp on your machine. Then open it like any other app. Headlamp reads your kubeconfig and uses the same identity and RBAC rules as kubectl.
Windows
Install with WinGet:
winget install headlamp
Or with Chocolatey:
choco install headlamp
macOS
Install with Homebrew:
brew install --cask headlamp
Linux
Install with Flatpak (Flathub):
flatpak install flathub io.kinvolk.Headlamp
Quick check
- Launch Headlamp.
- Confirm you can see a cluster context.
- Open a namespace you can access and confirm you can list workloads. Headlamp will only show actions your RBAC allows.
4.2 In-cluster install (shared access)
Use this path when you want a shared UI that the platform team can manage. Headlamp supports in-cluster deployment with Helm or a YAML manifest.
Install with Helm
Add the repo and update:
helm repo add headlamp https://kubernetes-sigs.github.io/headlamp/
helm repo update
Create a namespace (example):
kubectl create namespace headlamp
Install the chart:
helm install headlamp headlamp/headlamp --namespace headlamp
Install with a YAML manifest (optional)
Headlamp also provides a YAML manifest you can apply and then adjust to your needs.
Check the install
Confirm the pod is running:
kubectl get pods -n headlamp
Confirm the service exists:
kubectl get svc -n headlamp
Access it (two common ways)
Quick test with port-forward
This is the fastest way to verify the service works:
kubectl port-forward -n headlamp svc/headlamp 8080:80
Then open: http://localhost:8080
Shared access with ingress
If you want a stable URL, expose the service through your ingress controller. Your exact ingress YAML depends on your setup. Headlamp's OIDC callback URL is your public URL plus /oidc-callback, so ingress and TLS settings matter.
4.3 Updating Headlamp
Updates depend on how you installed Headlamp. Package managers upgrade in place. DMG or EXE installs update by reinstalling the newer download.
macOS
If you installed with Homebrew, run:
brew upgrade headlamp
If you installed from a DMG, download the newest DMG and drag Headlamp into /Applications, replacing the old version. DMG installs do not auto upgrade.
Windows
If you installed with WinGet, run:
winget upgrade headlamp
If you installed with Chocolatey, run:
choco upgrade headlamp
If you installed from the EXE, download the newest installer and run it again. EXE installs do not auto upgrade.
Linux
If you installed with Flatpak, run:
flatpak update io.kinvolk.Headlamp
If you installed with AppImage, download the newest AppImage and run that file instead.
If you installed with a tarball, download the newest tarball, extract it, and run the new headlamp binary.
4.4 Notes for in-cluster access (keep it safe)
Treat an in-cluster UI like any other cluster-facing service. Use TLS, lock down who can reach it, and rely on Kubernetes auth and RBAC to control what users can do.
5. Authentication and RBAC
Headlamp uses the Kubernetes API the same way kubectl does. Your cluster still decides who can do what. Headlamp only shows actions your identity is allowed to take.
This section covers two setups: desktop and in-cluster.
5.1 Desktop: use kubeconfig
On desktop, Headlamp reads your kubeconfig and uses the same credentials you use with kubectl. There is no separate token login flow to manage.
Step 1: Confirm your kubeconfig works
Run:
kubectl config current-context
Then test access:
kubectl get nodes
If you cannot list nodes, test a namespace you can access:
kubectl get pods -n <namespace>
If these commands work, your kubeconfig and credentials are valid for Headlamp too.
Step 2: Point Headlamp at the right kubeconfig (if needed)
Headlamp can use the default kubeconfig path. It can also use a custom file path. You can set KUBECONFIG to choose a specific file.
Example:
KUBECONFIG=/path/to/config headlamp
You can also use more than one kubeconfig file at once. On Unix systems, separate paths with :. On Windows, separate paths with ;.
What to expect in the UI
Headlamp adapts to your RBAC permissions. If you do not have permission to edit or delete a resource, Headlamp will not offer those actions.
5.2 In-cluster: shared access needs a sign-in plan
In-cluster Headlamp is shared by many users. You need a clear plan for sign-in and access. Headlamp supports OpenID Connect (OIDC) for a "Sign in" flow.
You will usually choose one of these patterns:
- A. Configure Headlamp with OIDC (built-in).
- B. Put an auth layer in front of Headlamp (common in enterprises).
A. Built-in OIDC (Headlamp)
To use OIDC, Headlamp needs:
- Client ID
- Client secret
- Issuer URL
- (Optional) scopes
Your OIDC provider must also allow Headlamp's callback URL. The callback is your Headlamp URL plus:
/oidc-callback
Example:
https://headlamp.example.com/oidc-callback
Ingress note
If Headlamp is behind an ingress or load balancer, make sure it forwards X-Forwarded-Proto. If it does not, Headlamp may generate an http callback URL instead of https. That can break login.
B. Auth layer in front of Headlamp
Some teams protect Headlamp with an identity-aware proxy or a platform auth system. This keeps sign-in consistent across tools. Headlamp docs include an example using OpenUnison, which can deploy Headlamp with hardened defaults and integrate with identity providers.
5.3 RBAC: keep it least privilege
Kubernetes security starts with API authentication and authorization (RBAC). Headlamp respects those rules.
Practical guidance:
- Start with the lowest permissions that still let users do their job.
- If Dashboard used a high-privilege service account token, plan to remove or tighten that access after the move.
- For in-cluster, treat the UI like any other endpoint. Use TLS and limit network access.
5.4 Quick troubleshooting
Desktop: "I do not see my cluster"
Your kubeconfig may not be in the default location. Point Headlamp to the file with KUBECONFIG or a file path.
In-cluster: "OIDC login fails after redirect"
Confirm your provider allows https://YOUR_URL/oidc-callback. If you use ingress, make sure it forwards X-Forwarded-Proto.
6. Manage multiple clusters
Kubernetes Dashboard is usually tied to one cluster at a time. Headlamp is built for multi-cluster work. It is a client that follows your kubeconfig, not a single cluster install. That means you can keep one UI open and switch clusters as you work.
Clusters come from your kubeconfig
Headlamp reads clusters from your kubeconfig files. That means the clusters you can access with kubectl can also show up in Headlamp.
Switch clusters in the UI
Once Headlamp loads your kubeconfig, you can switch clusters using the cluster selector. This makes it easier to move between dev, staging, and prod without changing tools.
Optional: use more than one kubeconfig file
If you keep separate kubeconfig files, you can load them together. Headlamp supports multiple kubeconfig paths in KUBECONFIG.
Unix/macOS/Linux (: separator):
KUBECONFIG=~/.kube/dev:~/.kube/prod headlamp
Windows (; separator):
$env:KUBECONFIG="$HOME\.kube\dev;$HOME\.kube\prod"
Optional: add a cluster from inside Headlamp
You can also add clusters by loading additional kubeconfig files from the UI.
Permissions stay the same
Multi-cluster does not change security rules. Each cluster still enforces its own RBAC. Headlamp shows only what your identity can do in the selected cluster.
7. Navigate and understand resources
If you used Kubernetes Dashboard, this part will feel familiar. Headlamp keeps the same core resource views, but makes it easier to move around and understand what is connected.
Find resources in familiar places
Headlamp groups resources in a way that maps closely to Dashboard:
- Workloads for Pods, Deployments, StatefulSets, and Jobs
- Network for Services and Ingress
- Storage for PersistentVolumes and Claims
- Configuration for ConfigMaps and Secrets
- Nodes for cluster infrastructure
You can filter by namespace at the top of the UI, just like in Dashboard.
Inspect and edit resources
From any list, you can click into a resource to see details:
- Status and conditions
- Events
- Labels and annotations
- The full YAML definition
If your RBAC allows it, you can edit YAML directly from the UI. If it does not, Headlamp shows the resource as read-only. This matches how kubectl behaves.
Use search and filters to move faster
Headlamp adds faster search and filtering across lists. This helps when clusters or namespaces get large. You can narrow views without jumping between pages.
Understand relationships with Map View
Dashboard mostly shows resources as lists. Headlamp also includes a Map View.
Map View shows how resources relate to each other:
- Deployments
- ReplicaSets
- Pods
- Services
This helps when you are troubleshooting. Instead of clicking through several pages, you can see the connections at once. You can spot missing links or broken relationships faster.
When to use lists vs Map View
- Use lists when you know what resource you are looking for.
- Use Map View when you are trying to understand why something is not working.
Both views work on the same data. You are just choosing how much context you want at that moment.
8. Deploy applications with YAML
This is the biggest change for most Kubernetes Dashboard users. Dashboard relied on forms. Headlamp relies on manifests. The goal is not to slow you down. It is to align the UI with how Kubernetes is usually run in practice.
From forms to manifests
In Kubernetes Dashboard, you often deployed an app by filling in a form:
- container image
- replicas
- service type
Headlamp does not include the same wizard. Instead, it lets you apply YAML directly from the UI.
This matches how most teams deploy today:
- manifests live in Git
- CI/CD applies them
- Helm or GitOps tools manage changes
Headlamp fits into that flow rather than replacing it.
Create resources using YAML
To deploy an application in Headlamp:
- Select a cluster and namespace.
- Click Create.
- Paste or upload a YAML manifest.
- Review it.
- Click Apply.
The resource appears immediately in the UI.
If the manifest is not valid, Headlamp shows the same errors you would see from the Kubernetes API.
Generate YAML the easy way
If you miss the Dashboard wizard, you can still generate YAML quickly.
For example:
kubectl create deployment nginx \
 --image=nginx \
 --dry-run=client \
 -o yaml > nginx.yaml
You can edit the file if needed, then paste it into Headlamp and apply it.
This gives you a repeatable manifest instead of an object created only through a UI.
What if you use Helm or GitOps?
That works well with Headlamp.
- Install with Helm as usual.
- Deploy with GitOps pipelines as usual.
- Use Headlamp to view, inspect, and debug what is running.
Headlamp does not replace those tools. It gives you visibility into what they create.
What to expect compared to Dashboard
- You will not see a multi-step deploy form.
- You will work more with YAML.
- You gain clarity about what is actually applied to the cluster.
- The same manifest can be reused in CI, Git, or other tools.
9. Deploy and debug workloads
One of the main reasons people used Kubernetes Dashboard was day-to-day debugging. Headlamp covers the same tasks and adds a few useful upgrades.
View logs
You can view pod logs directly in the UI.
To check logs:
- Open Workloads.
- Select Pods.
- Click a pod.
- Open the Logs tab.
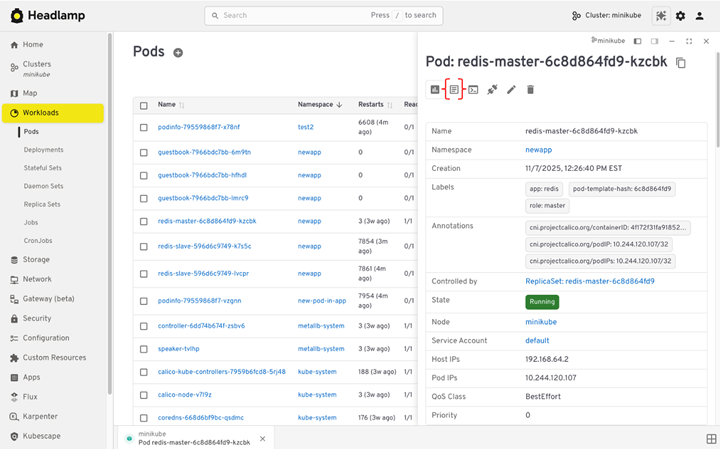
If the pod has more than one container, you can switch between containers. Logs stream live, which helps during rollouts or active incidents.
Exec into running pods
Headlamp also lets you open a shell inside a container.
From a pod view:
- Open the pod actions menu.
- Choose Terminal or Exec.
This opens an interactive session inside the container. It replaces the need to switch back to the terminal for quick checks.
This action follows RBAC rules. If you cannot run kubectl exec, Headlamp will not allow it either.
Check metrics and resource usage
Headlamp can show CPU and memory usage for pods and nodes. This works the same way it did in Dashboard.
A few things to know:
- Metrics require
metrics-serverto be installed in the cluster. - If metrics are missing, Headlamp shows a clear notice.
- Once metrics are available, usage appears on pod and node views.
This makes it easy to answer simple questions:
- Is this pod using too much memory?
- Is a node under pressure?
View events when something goes wrong
Events are often the fastest way to understand failures.
In Headlamp, you can:
- View events on resource detail pages.
- See warnings and errors tied to pods, nodes, or deployments.
This is often the first place to look when a workload is stuck or crashes.
How this compares to Dashboard
What stays the same:
- Log viewing
- Event inspection
- RBAC-aware actions
What improves:
- Built-in exec sessions
- Clearer layout and filtering
- Fewer context switches between UI and CLI
10. Remove Kubernetes Dashboard
After Headlamp is working and your team is comfortable using it, you can remove Kubernetes Dashboard. This is the final cleanup step.
Removing Dashboard reduces clutter and avoids keeping unused access paths around.
Confirm Headlamp covers your needs
Before uninstalling anything, make sure:
- Users can access the clusters they need in Headlamp.
- Common tasks work:
- browse resources
- deploy with YAML
- view logs and events
- exec into pods (if allowed)
- RBAC behaves as expected for different roles.
Once these checks pass, you are ready to remove Dashboard.
Uninstall the Dashboard
If you installed Kubernetes Dashboard with Helm, remove it with:
helm uninstall kubernetes-dashboard -n kubernetes-dashboard
If Dashboard was installed by a manifest or addon, remove it using the same method you used to install it.
After removal, confirm the resources are gone:
kubectl get pods -n kubernetes-dashboard
Clean up access artifacts (recommended)
Many Dashboard setups used dedicated service accounts and cluster-wide roles.
Review and remove anything that was created only for Dashboard access, such as:
- service accounts
- role bindings or cluster role bindings
- old documentation that points users to Dashboard URLs or port-forward commands
This reduces long-lived credentials and unused permissions.
Communicate the change
Make sure your team knows:
- Headlamp is now the primary Kubernetes UI.
- How to access it (desktop or URL).
- Where to go for help if something feels different.
11. Post-migration checklist
This final checklist helps you confirm the migration is complete. It gives you confidence that Headlamp is working as expected and that nothing important was left behind.
Access and visibility
- Headlamp opens without errors.
- Users can access the correct clusters.
- Namespace filtering works as expected.
- Multi-cluster switching behaves correctly.
Authentication and RBAC
- Desktop users access clusters using kubeconfig.
- In-cluster users can sign in using the chosen auth method.
- Users only see actions their RBAC allows.
- No unexpected permission errors appear during normal use.
Core workflows
- Resources load under Workloads, Network, and Configuration.
- YAML can be viewed and edited where permissions allow.
- Applications can be deployed using Create and YAML.
- Logs load correctly for running pods.
- Exec works for users who are allowed to use it.
- Metrics appear if metrics-server is installed.
Operational confidence
- Teams can troubleshoot without switching tools.
- Map View helps explain relationships during debugging.
- Platform or DevOps teams know how Headlamp is installed and managed.
Cleanup confirmation
- Kubernetes Dashboard is no longer running.
- Dashboard-only service accounts and RBAC bindings are removed.
- Internal docs no longer reference Dashboard URLs or port-forward commands.
Team alignment
- The team knows Headlamp is the default Kubernetes UI.
- Onboarding docs point new users to Headlamp.
- There is a clear path for feedback or questions.
You've now completed the move from Kubernetes Dashboard to Headlamp. Your team can use the same Kubernetes access model, work across clusters, and rely on workflows that match how Kubernetes is used today. From here, Headlamp becomes your default UI, whether on the desktop or in shared environments. As your needs grow, you can keep using it as-is or extend it with plugins and new views over time.
If you want to help shape what comes next, join the Headlamp community and contribute at headlamp.dev.
13 Jul 2026 6:00pm GMT
08 Jul 2026
Kubernetes Blog
Announcing etcd v3.7.0
This article is a mirror of the original announcement
Today, SIG etcd is releasing etcd v3.7.0, the latest minor release of the popular distributed key-value store and core Kubernetes component. v3.7 ships the long-requested RangeStream feature, delivers several other performance improvements, removes the last remnants of the legacy v2store, and completes a major protobuf overhaul.
You can download etcd v3.7.0 here:
This release also includes new versions of the two core etcd dependencies, bbolt v1.5.0 and raft v3.7.0.
For instructions on installing etcd, see the install documentation. For the full list of changes, see the etcd v3.7 changelog.
A heartfelt thank you to all the contributors who made this release possible!
Major features
The most significant changes in v3.7.0 include:
- RangeStream - stream large result sets in chunks instead of buffering the whole response.
- Keys-only range requests, faster and more reliable leases, and several other performance improvements.
- etcd now boots entirely from v3store, eliminating a long-standing dependency on the legacy v2 store
- A completed protobuf overhaul, replacing outdated protobuf libraries with fully supported ones.
- etcd v3.7 ships with bbolt v1.5.1 and raft v3.7.0.
Features
RangeStream
In etcd v3.6 and earlier, it is challenging to work with requests that return large result sets. The database would buffer the full result set before sending, leading to unpredictable latency and memory usage, both on the server and the client. The RangeStream RPC lets calling applications accept result sets in chunks, reducing latency and making buffering memory usage more predictable.
Instructions on how to use RangeStream in gRPC calls and in etcdctl can be found in the etcd documentation. Users should try it out for their own applications.
In coordinated releases, the RangeStream feature will become available to users running the upcoming v1.37 of Kubernetes by enabling the EtcdRangeStream feature gate. This early and planned adoption is possible thanks to the merger of etcd and Kubernetes development in 2023.
Performance improvements
v3.7 delivers multiple specific performance improvements, both for the Kubernetes control plane and for other use cases. Kubernetes users should see a significant decrease in overall CPU usage by the etcd members, compared with v3.6.
Keys-only range optimization
etcd v3.7.0 includes a keys-only Range optimization (#21791: keys-only Range optimization). When processing a keys_only Range request or etcdctl get --keys-only, etcd reads solely from its in-memory index. It returns the matched keys without loading all serialized values from bbolt as it did previously. The only exception where loading from bbolt is still required is when keys_only Range requests must be sorted by value (i.e., when SortTarget is set to VALUE).
This reduces unnecessary backend reads and memory use for workloads that only need key names, making large keys-only range requests more efficient.
Faster, more reliable etcd leases
v3.7 improves lease expiration and renewal:
- LeaseRevoke requests are now prioritized to ensure timely lease expiration during overload (#20492: stability enhancement during overload conditions).
- The new FastLeaseKeepAlive feature enables faster lease renewal by skipping the wait for the applied index (#20589: etcdserver: improve linearizable renew lease).
Faster find() operations
etcd 3.7 improves the performance of concurrent watches on keys by making find() operations faster (#19768: adt: split interval tree by right endpoint on matched left endpoints).
Other features
Protobuf overhaul
v3.7 migrates and replaces multiple outdated protobuf libraries with fully supported dependencies. This includes replacing github.com/golang/protobuf and github.com/gogo/protobuf with the fully-supported google.golang.org/protobuf (#14533: Protobuf: cleanup both golang/protobuf and gogo/protobuf), and migrating grpc-logging to grpc-middleware v2 (#20420: Migrate grpc-logging to grpc-middleware v2).
As well as improving security and maintainability, this refactor has been shown to reduce CPU usage by etcd components.
While these changes are not expected to directly affect users running etcd via official binaries or container images, they may affect users who depend on etcd Go modules, such as the client SDK or packages under api/ or pkg/. These consumers may need to update their code or dependencies due to protobuf and related API changes introduced in this release. More detailed information is available from the API change tracking issue.
Unix socket support
etcd now supports Unix socket endpoints (#19760: Add Support for Unix Socket endpoints), enabling local communication without a TCP port. Since this is restricted to single-member clusters, it is mainly aimed at development, testing, and edge device use-cases.
Bootstrap from v3store
One of the major changes in etcd v3.7 is that the server now bootstraps entirely from the v3 store (#20187 Bootstrap etcdserver from v3store), eliminating its dependency on the legacy v2 store during startup.
This milestone is the result of a long-term effort spanning multiple releases, from v3.4 through v3.7. It resolves a long-standing technical debt, significantly simplifies the bootstrap workflow, and lays the foundation for future improvements to etcd.
To maintain backward compatibility, etcd v3.7 continues to generate v2 snapshots. As a result, the --snapshot-count flag is also retained in v3.7. This is the last remaining dependency on the legacy v2 store, and both the v2 snapshot generation and the --snapshot-count flag will be removed in v3.8.
etcdutl timeouts
All etcdutl commands now have a timeout command line argument (#20708: etcdutl: enable timeout functionality for all commands), so offline utility commands no longer block indefinitely when holding a lock.
Setting the authentication token directly
Client v3 now allows users to set the JWT directly, offering more flexibility in authentication options (#16803: clientv3: allow setting JWT directly, #20747: clientv3: disable auth retry when token is set),
Retrieve AuthStatus without authenticating
Clients can check their AuthStatus without attempting to authenticate first, eliminating some application overhead (#20802: etcdserver: remove permission check on AuthStatus api).
New watch metrics
v3.7 adds optional watch send-loop metrics (#21030: Instrument watchstream send loop) for better observability of the watch path:
etcd_debugging_server_watch_send_loop_watch_stream_duration_secondsetcd_debugging_server_watch_send_loop_watch_stream_duration_per_event_secondsetcd_debugging_server_watch_send_loop_control_stream_duration_secondsetcd_debugging_server_watch_send_loop_progress_duration_seconds
There is also a new etcd_server_request_duration_seconds metric (#21038: Add metric etcd_server_request_duration_seconds).
etcdctl command cleanup
etcdctl commands were reorganized for clarity (#20162: etcdctl: organize etcdctl subcommand) and global command line arguments are now hidden to streamline help output (#20493: etcdctl: hide global flags).
Upgrading
This release contains breaking changes, particularly around the removal of legacy v2 components. Users should review the upgrade guide before upgrading their nodes. As with all minor releases, perform a rolling upgrade one member at a time and confirm cluster health between steps.
Experimental flags removed
All deprecated experimental flags have been removed (#19959: Cleanup the deprecated experimental flags). Features in etcd now follow the Kubernetes-style feature-gate lifecycle (Alpha → Beta → GA) introduced in v3.6, rather than the old --experimental prefix. If your configuration still relies on --experimental-* command line arguments, migrate to using the corresponding feature gates or stable command line arguments before you upgrade to etcd 3.7.
Legacy V2 API packages and code cleanup
To remove the dependencies on v2store, the following components have been removed:
- v2 discovery (#20109: Remove v2discovery) packages removed,
- v2 request support (#21263: Remove v2 Request and apply_v2.go)
- v2 client support (#20117: Remove client/internal/v2).
These changes may create some breakage for users, particularly those who have not already updated to v3.6.11 or later. Users should report any blockers encountered, or cases that need better upgrade documentation.
Non-blocking client creation
etcd no longer honors the deprecated grpc.WithBlock dial option ( #21942: Make the etcd client creation non-blocking). To preserve the previous blocking behavior when needed, follow the guidance in grpc-go's anti-patterns documentation.
Multiarch container images only
For users relying on the official etcd container images, v3.7 will be distributed only as multiarch containers. Architecture-tagged images will not be available, so adjust deployments accordingly.
API changes
As with every etcd release, there are a number of API changes. These are designed to be backwards-compatible to the extent possible, but may require adjustment by some users. See our API documentation page for full information.
bbolt v1.5.1
etcd v3.7 depends on, and includes, v1.5.1 of the bbolt storage engine. v1.5 includes several improvements to functionality and performance, including:
- Database file size limits: users may set, and bbolt will enforce, file size limits. When a bolt database exceeds these limits it will refuse to accept writes until the database is compacted or the limit is changed.
- Disable statistics for performance: users may set
NoStatisticsto limit overhead from locks taken by the database statistics viewer. - More efficient hashmap processing: merge spans faster and with less overhead.
raft v3.7.0
etcd 3.7 depends on, and includes, v3.7.0 of the raft consensus engine. v3.7 includes several improvements, including:
- Update the bootstrap process: v3.7 now allows booting from partly initialized snapshots, supporting etcd's initializing directly from v3store.
- Improve the ReadIndex flow to prevent stale reads by injecting a unique identifier into the heartbeat context for read-only operations.
raft v3.7.0 also includes the same protobuf library updates and refactoring as etcd does.
Dependency updates
Other dependency updates include a bump to golang.org/x/crypto v0.52.0 for CVE resolution (#21903: [release-3.7] Bump golang.org/x/crypto to v0.52.0), an OpenTelemetry contrib update to v0.61.0 (#20017: Update otelgrpc to v0.61.0), and compilation with Go 1.26.4 (#21891: [release-3.7] Update Go to 1.26.4).
Contributors
etcd v3.7.0 is the product of more than a hundred contributors across the community. Thank you to everyone who wrote code, reviewed PRs, filed and triaged issues, and helped test the alpha, beta, and release candidates.
Leads
The SIG etcd leads for the v3.7 release are ivanvc, serathius, ahrtr, fuweid, siyuanfoundation, and jberkus. Ivan leads our release team.
Other contributors
ah8ad3, ajaysundark, aladesawe, amosehiguese, ArkaSaha30, ashikjm, AwesomePatrol, dims, Elbehery, gangli113, henrybear327, Jille, jmhbnz, joshuazh-x, kishen-v, lavishpal, liggitt, marcelfranca, miancheng7, mmorel-35, MrDXY, mrueg, purpleidea, qsyqian, redwrasse, ronaldngounou, skitt, spzala, tcchawla, tjungblu, vivekpatani, wenjiaswe
New contributors
A special welcome to the contributors who made their first etcd contribution in this cycle - including Jeffrey Ying, whose work drove the RangeStream feature. New contributors can have a substantial impact on etcd; if you'd like to get involved, see the contributor guide.
1911860538, 4rivappa, aaronjzhang, abdurrehman107, ABin-Huang, adeptvin1, aditya7880900936, AHBICJ, akstron, alliasgher, aman4433, aojea, apullo777, AR21SM, arturmelanchyk, AshrafAhmed9, asttool, asutorufa, BBQing, beforetech, boqishan, caltechustc, carsontham, christophsj, chuanye-gao, cnuss, cuiweixie, dmvolod, Dogacel, dongjiang1989, EduardoVega, evertrain, eyupcanakman, gaganhr94, goingforstudying-ctrl, greenblade29, Himanshu-370, HossamSaberX, huajianxiaowanzi, hwdef, ishan-gupta2005, ishan16696, ivangsm, JasonLove-Coding, Jefftree, jihogh, jonathan-albrecht-ibm, joshjms, kairosci, kei01234kei, kjgorman, kovan, kstrifonoff, Kunalbehbud, letreturn, lorenz, m4l1c1ou5, madhav-murali, madvimer, majiayu000, marcus-hodgson-antithesis, mattsains, mcrute, mingl1, MohanadKh03, mstrYoda, NAM-MAN, neeraj542, nicknikolakakis, nihalmaddala, niuyueyang1996, notandruu, ntdkhiem, nwnt, olamilekan000, pigeio, pjsharath28, progmem, Qian-Cheng-nju, quocvibui, ravisastryk, robin-vidal, robinkb, rockswe, roman-khimov, rsafonseca, sahilpatel09, SalehBorhani, SebTardif, seshachalam-yv, shashwat010, shivamgcodes, shuan1026, silentred, sneaky-potato, socketpair, srri, subrajeet-maharana, sxllwx, tchap, tsujiri, tzfun, upamanyus, uzairhameed, varunu28, vihasmakwana, wendy-ha18, xiaoxiangirl, xigang, xUser5000, yagikota, yajianggroup, yedou37, Zanda256, zechariahkasina, zhijun42, zhoujiaweii
Feedback can be shared through:
08 Jul 2026 12:00pm GMT
26 Jun 2026
Kubernetes Blog
Open source maintainership in the age of AI
AI has really changed the game around software development. More people are leveraging AI than ever to contribute patches to projects they use. To me, this is a good thing as more folks will contribute patches rather than fork or not fix them. The main problem is that AI has made generating code fast but there has been very little improvement in maintaining code bases. In this post, we will highlight the ways the Kubernetes community is adapting to the world of AI assisted coding.
The first step of this journey was to develop an AI policy. This seems mundane and bureaucratic but there were many PRs that derailed into discussions around AI usage. The AI policy helps steer the conversation around the project's stance on AI and provides a clear signal to contributors on how to use these tools responsibly.
Kubernetes AI policy
The Kubernetes project has established clear guidelines for AI-assisted contributions that balance innovation with accountability. These policies are designed to maintain code quality and ensure human oversight while acknowledging that AI tools can be valuable aids in the development process.
Transparency first
Contributors must disclose when AI tools have been used to assist with a pull request. A simple statement in the PR description such as "This PR was written in part with the assistance of generative AI" is sufficient. This transparency helps reviewers understand the context and apply appropriate scrutiny.
Human accountability
While AI tools can assist, the human contributor remains fully responsible for every change. The policy explicitly prohibits:
- Listing AI as a co-author on commits
- Using AI co-signing on commits
- Adding trailers like "assisted-by" or "co-developed" that attribute work to AI
This isn't about diminishing AI's role as a tool-it's about maintaining clear accountability. If something breaks, there needs to be a human who understands why and can fix it.
CLA enforcement for co-authors
The CNCF provides a tool for verifying the contributor license agreements on each pull request. AI agents are not able to solve these contributor license agreements so one enforcement the project made is to enable the CLA check for co-authors. This provides a flag to reviewers that the PR is not ready to merge.
Human engagement required
Perhaps the most critical aspect of the policy: reviewers expect to engage with humans, not with AI. Contributors cannot rely on AI to respond to review comments. If you cannot personally explain changes that AI helped generate, your PR will be closed. This requirement ensures that knowledge transfer happens and that contributors genuinely understand the code they're submitting.
Verification obligations
Contributors must verify AI-generated changes through code review, testing, and personal understanding. It's not enough for the code to work-you need to know why it works and be able to maintain it.
These policies reflect a mature approach to AI: embrace it as a tool, but never let it replace human judgment, understanding, or responsibility.
Automated AI reviews
There exist many tools to aid in reviewing code. AI pull request tools introduce governance challenges so one of the first tasks the community took on was to document the process for what is needed to bring in new AI tools. One of the major evaluation criteria for these tools is to find maintainers willing to test drive them in kubernetes-sigs repositories. Kueue, JobSet and Agent-Sandbox have been experimenting with these tools to provide more support for maintainers.
Copilot
One tool that many maintainers started using was GitHub Copilot. The CNCF provides access for maintainers so this ended up being the first tool many started using. It provides some good experience on tuning reviews but there were some growing pains with this tool. The biggest blocker for community adoption is relying on contributors to have a copilot license. Only maintainers were able to request copilot reviews and automated reviews of pull requests was out of reach for the community. One of the goals of AI review tools is to provide an automated review tool that maintainers don't need to request. This demonstrated the need for organization control rather than relying on contributors having access.
CodeRabbit
In mid 2026, the Kubernetes community has rolled out CodeRabbit to a few projects. As with copilot, some tuning has been required to provide better reviews but the overall feedback has been positive. There is a lot of configuration available for this tool and one of the most interesting uses of this tool comes from agent-sandbox.
AI pull request tools can be a quality gate. Contributors can at least get a quick spot check review without waiting for a maintainer. Agent-sandbox has added a label on PRs to reflect that there is still a need to resolve some of the comments from AI tools.
Next steps
The reality is that leveraging AI in open source projects is an area of active exploration. The community could use your help in tuning reviews tools, evaluating tools or evaluating emerging technologies in the AI space.
Some areas we are exploring more:
- The use of AI skills to reduce maintainer burnout.
- AI assisted triage of failing tests.
- Skills to aid the operational aspects of Kubernetes.
26 Jun 2026 6:00pm GMT
25 Jun 2026
Kubernetes Blog
Introducing the Cluster API plugin for Headlamp
Headlamp is an open-source, extensible Kubernetes SIG UI project designed to let you explore, manage, and debug cluster resources directly from a browser.
Cluster API (CAPI) is a Kubernetes sub-project that brings declarative, Kubernetes-style APIs to cluster lifecycle management. It lets platform teams provision, upgrade, and manage the lifecycle of Kubernetes clusters using standard Kubernetes objects stored and reconciled in a management cluster.
Managing Cluster API resources has historically required raw kubectl commands and deep familiarity with ownership hierarchies. The Headlamp Cluster API plugin brings visual clarity, faster debugging, and simplified operations for platform teams, directly inside Headlamp.
What this plugin provides
The Cluster API plugin adds a dedicated Cluster API section to Headlamp and brings full visibility into core CAPI resources through consistent list and detail views.
| Feature | Description |
|---|---|
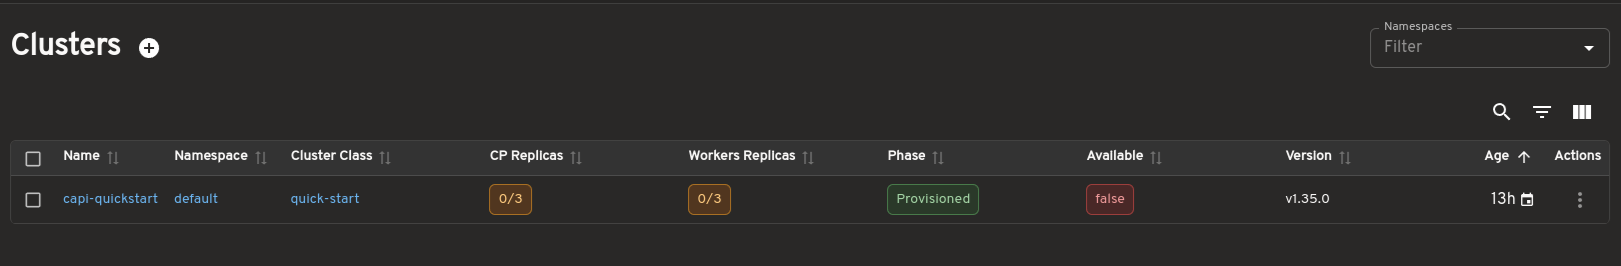
| Cluster overview | View clusters with live control plane and worker replica status. |
| Machine visibility | Inspect MachineDeployments, MachineSets, Machines, and MachinePools with status and conditions. |
| Cluster API dashboard | Get a centralized view of Cluster API resource health, active condition issues, provider information, and remediation guidance. |
| Control plane monitoring | Track KubeadmControlPlane replicas, versions, and associated Machines. |
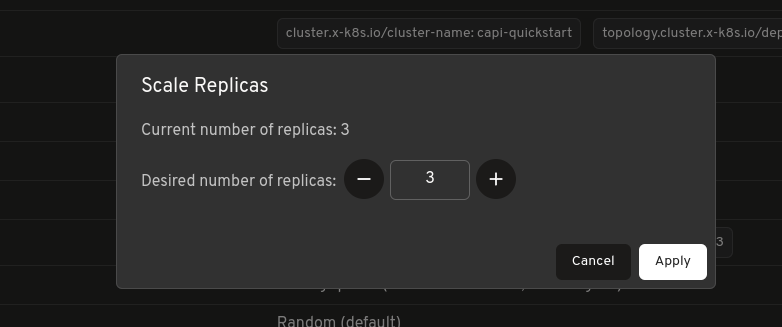
| Scale from the UI | Scale MachineDeployments and MachineSets directly from Headlamp. |
| Owned resource hierarchy | Trace relationships between clusters, deployments, sets, and machines. |
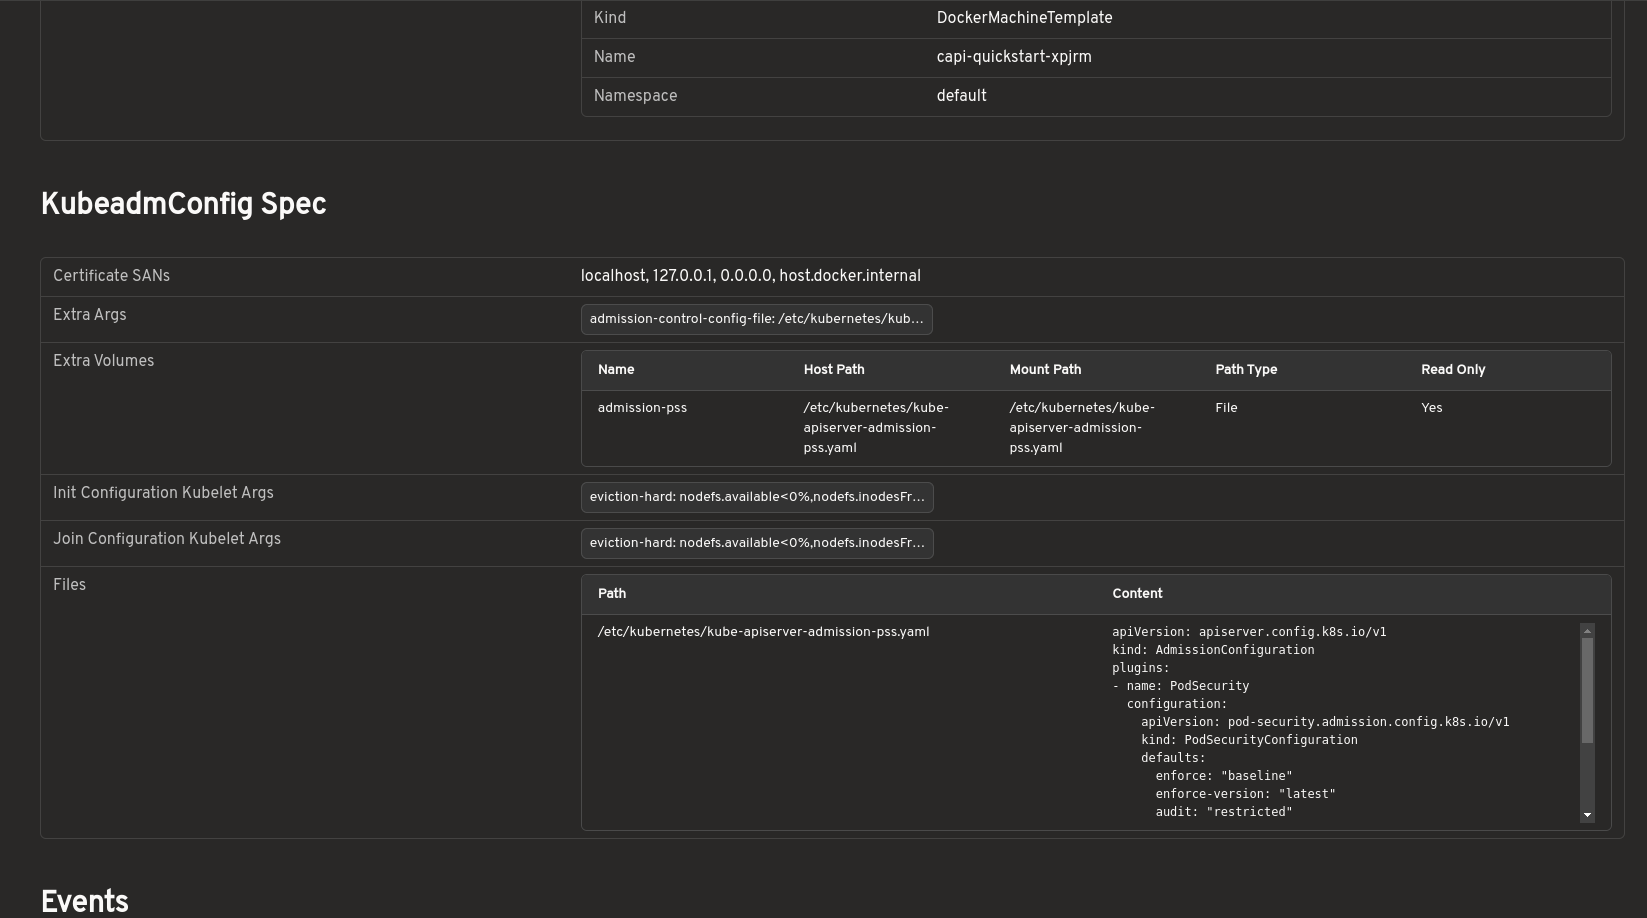
| KubeadmConfig inspection | View bootstrap configs, files, kubelet args, and join/init settings. |
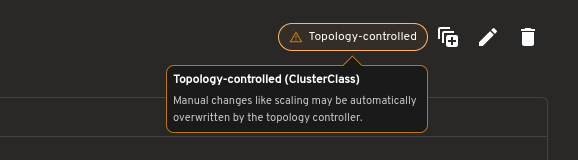
| Topology awareness | Automatically detect and label ClusterClass-managed resources. |
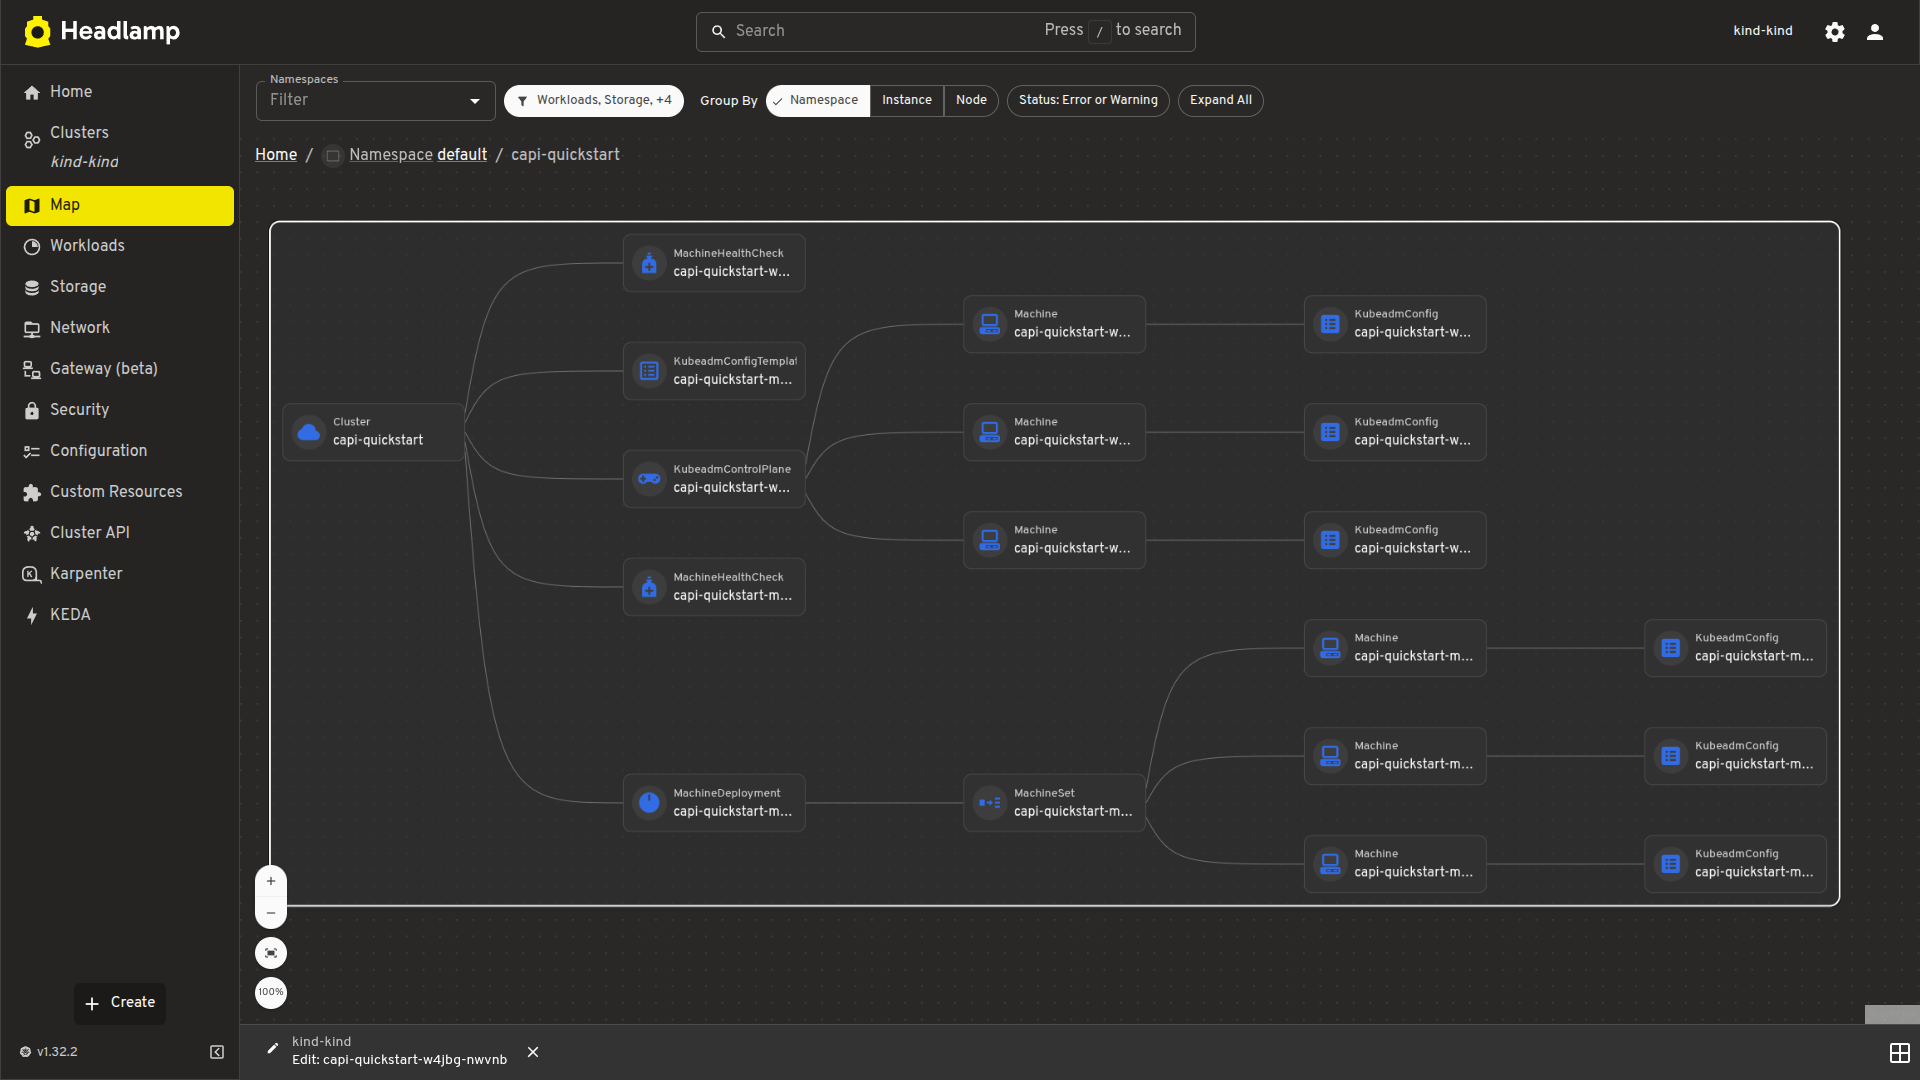
| Map view | Visualize Cluster, Control Plane, and Worker relationships. |
| Dynamic API versioning | Supports both v1beta1 and v1beta2 Cluster API versions. |
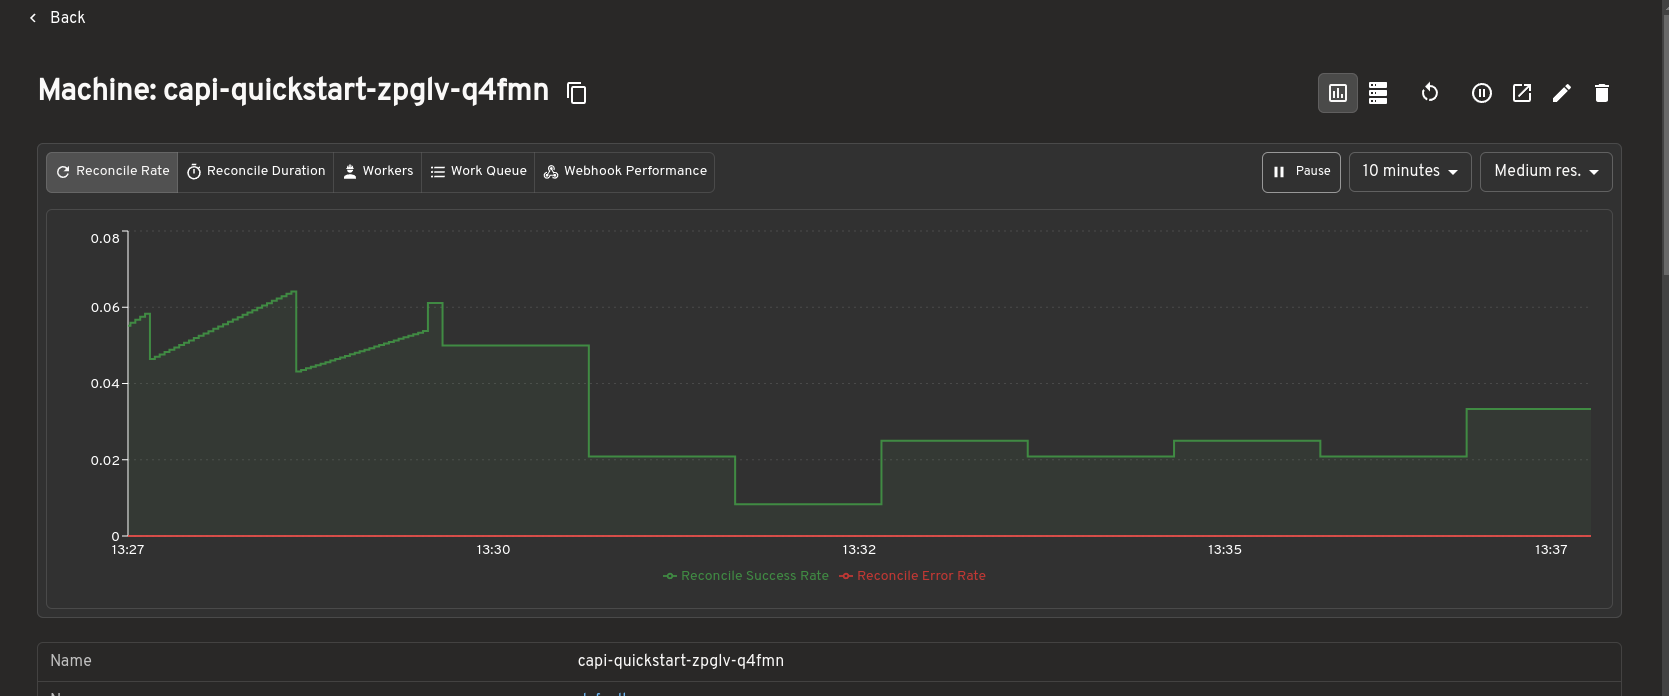
| Prometheus metrics | View live metrics from the Headlamp Prometheus plugin inline on Cluster API resource detail pages. |
A tour of the plugin
The Headlamp Cluster API plugin brings core Cluster API resources into a consistent, visual interface inside Headlamp. Here are some of the key views included in the first release.
Cluster API dashboard
The dashboard provides a centralized view of Cluster API resources and their health across a management cluster.
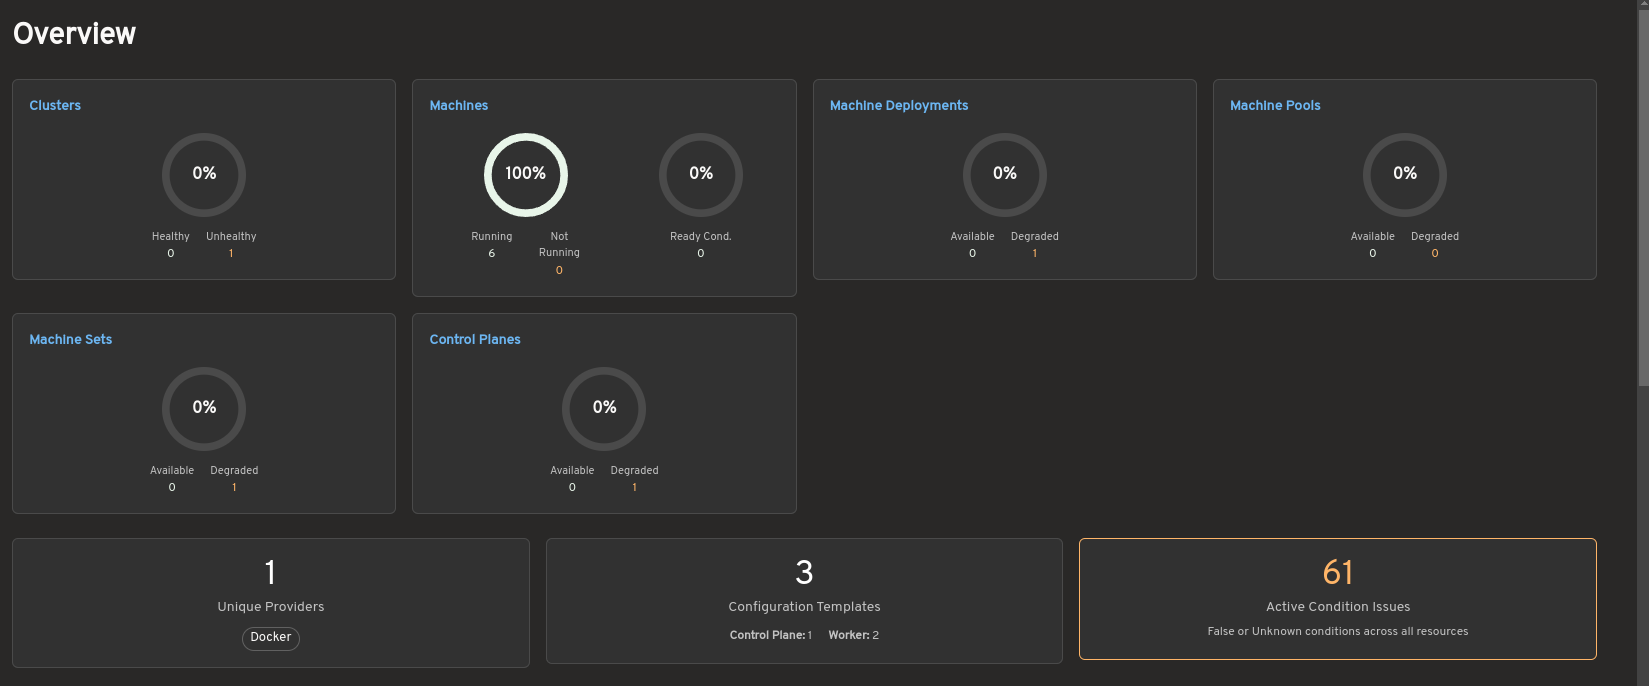
The overview summarizes the status of clusters, Machines, MachineDeployments, MachinePools, MachineSets, and control planes. It also highlights active condition issues, provider information, and configuration template counts to help operators quickly identify degraded or unhealthy resources.
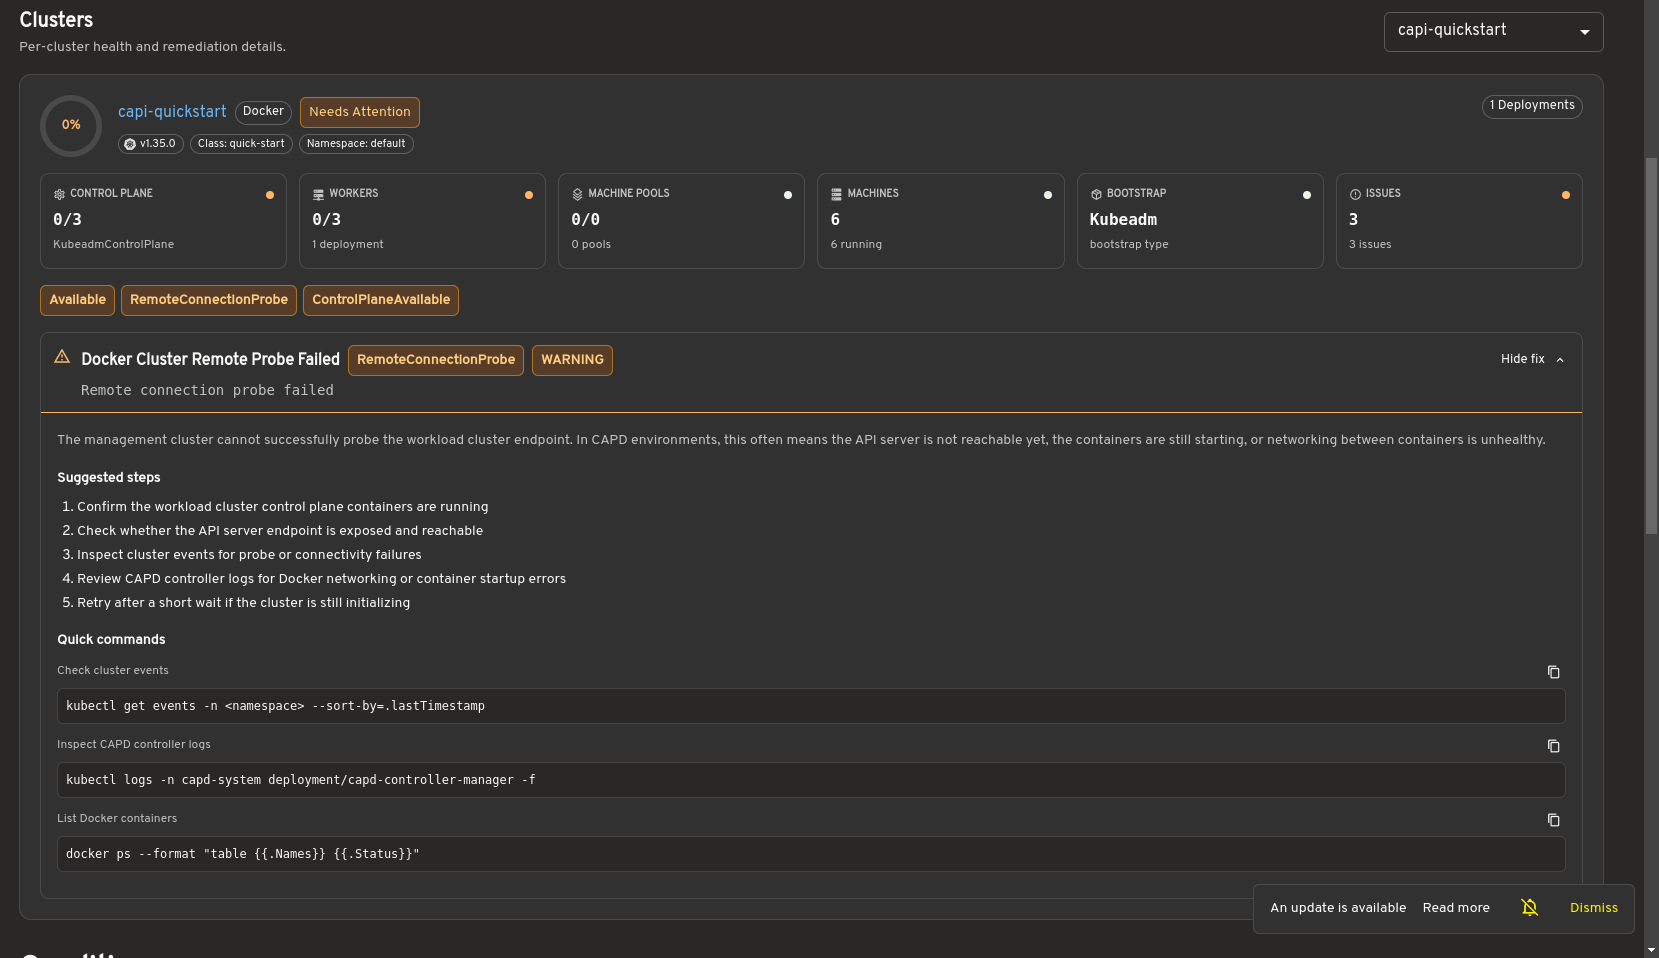
Selecting a cluster opens a detailed health view showing control plane and worker status, machine information, infrastructure details, and resource conditions. When issues are detected, the dashboard provides remediation guidance and diagnostic commands to assist with troubleshooting.
Bring full Cluster API visibility into Headlamp
The cluster list view shows all Cluster resources in the management cluster, including control plane and worker replica status. This gives you an at-a-glance understanding of overall cluster health.
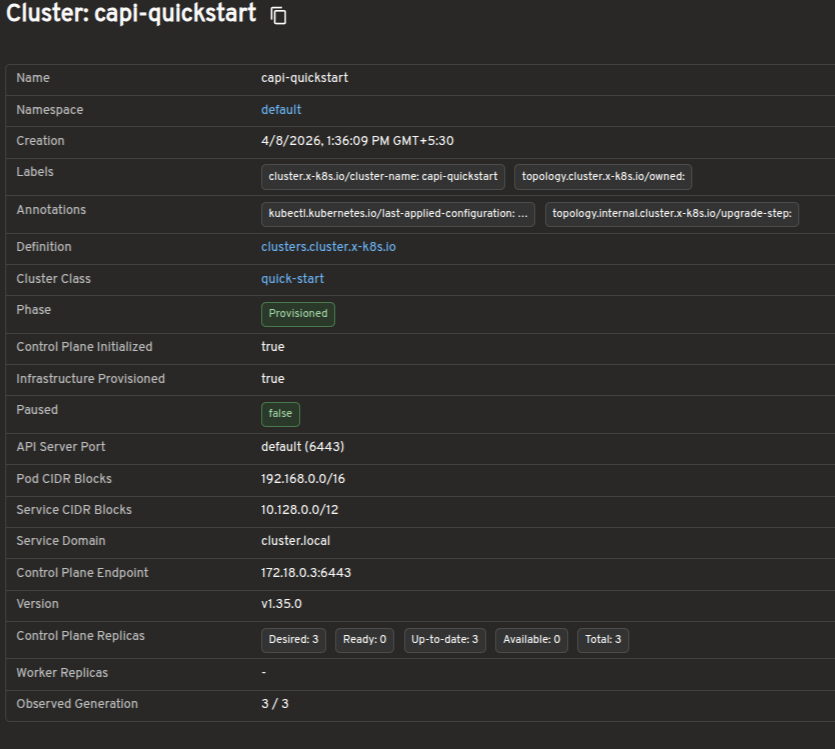
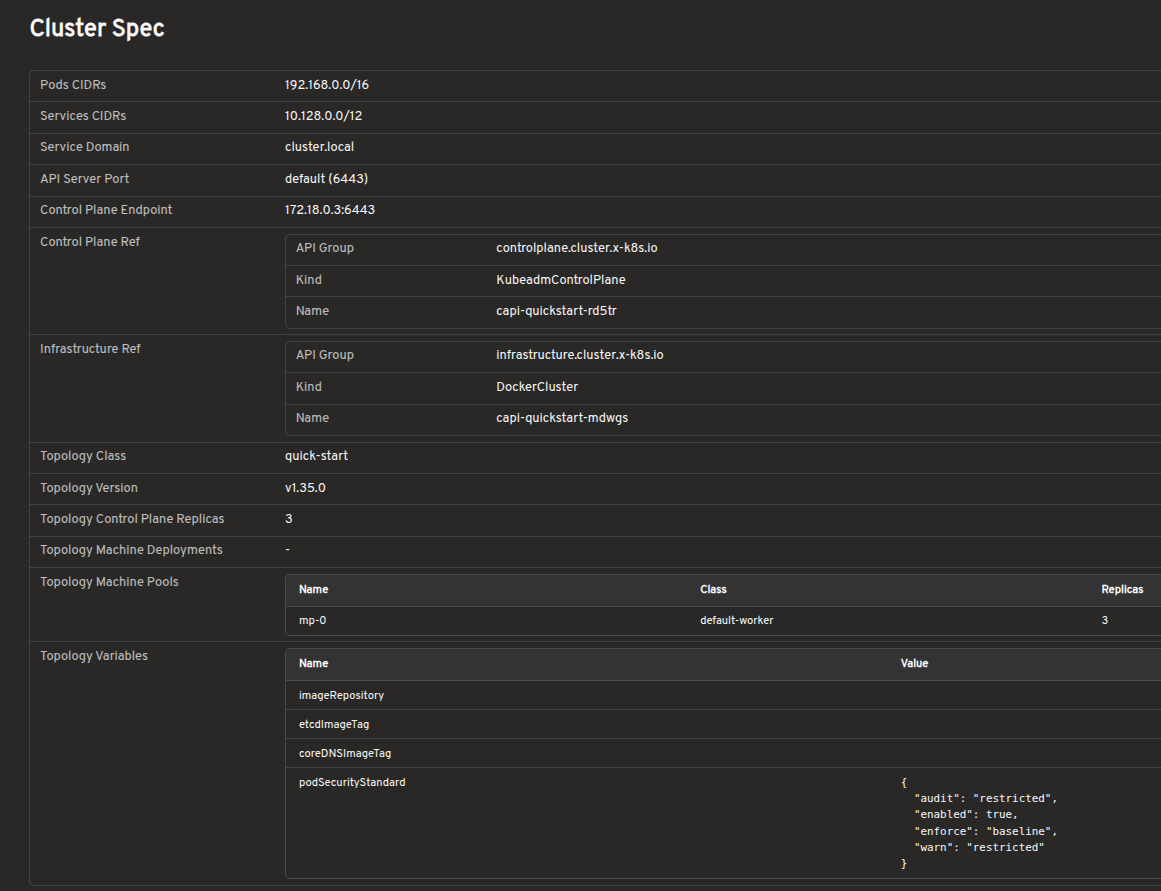
The cluster detail view provides resource status, conditions, infrastructure references, control plane references, and related Machines on a single page.
Explore Cluster API resources in a visual interface
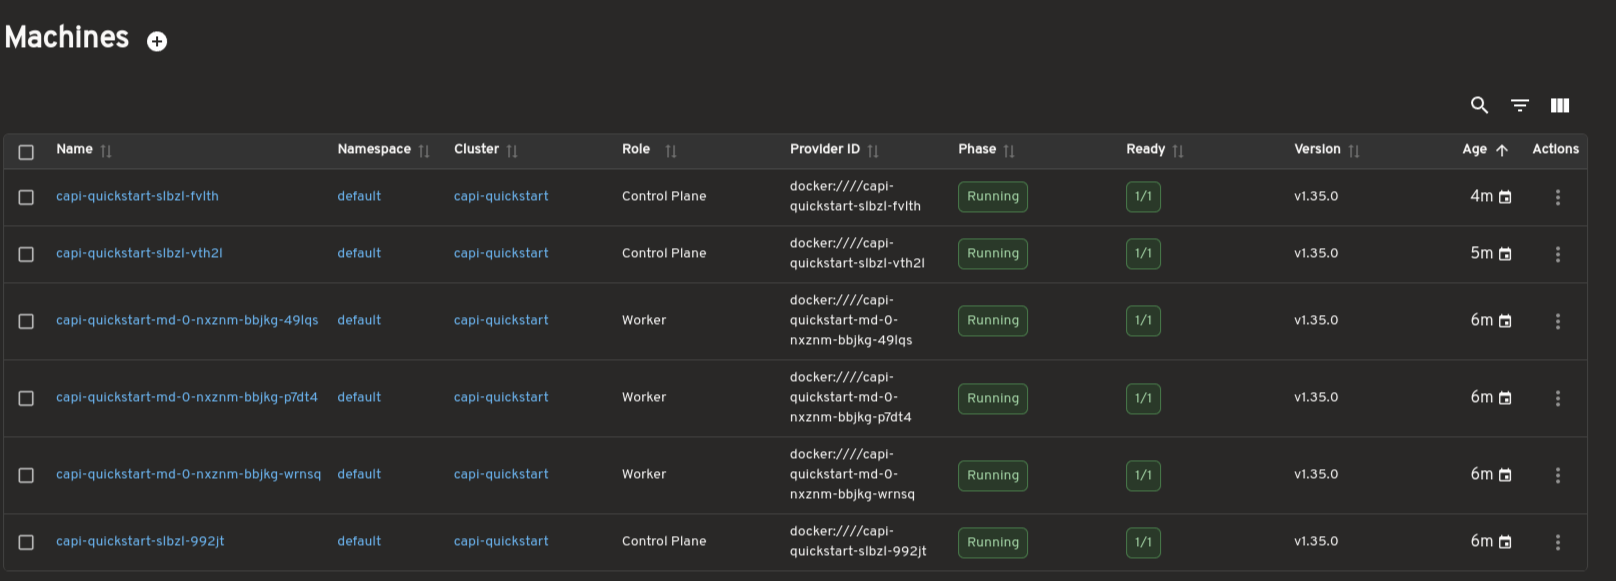
Dedicated views are available for MachineDeployments, MachineSets, Machines, and MachinePools. These pages surface replica counts, ownership relationships, provider IDs, versions, and conditions to support day-to-day operations and debugging.
Scale workloads directly from Headlamp
MachineDeployments and MachineSets include a built-in Scale action, allowing you to adjust replica counts directly from Headlamp without using terminal commands.
For topology-managed clusters, the plugin also indicates when scaling should be performed at the Cluster level.
Inspect bootstrap configuration without raw YAML
Bootstrap configurations can be viewed in a structured format, including inline files, kubelet arguments, extra volumes, and join or init settings. This removes the need to inspect raw YAML or secrets manually.
Visualize cluster relationships with map view
A visual map view displays the relationships between Cluster, control plane, and worker resources. It offers a faster way to understand ownership hierarchies and overall cluster structure.
Prometheus metrics integration
The Cluster API plugin integrates with the Headlamp Prometheus plugin to surface metrics directly inside Cluster API resource detail pages.
When the Prometheus plugin is installed and configured, metrics are embedded inline on the detail pages for Clusters, MachineDeployments, MachineSets, and Machines. You can view resource health and performance data alongside status conditions and ownership relationships, without switching to a separate dashboard.
This makes it easier to correlate infrastructure state with live metrics during debugging or day-to-day cluster operations, all from within Headlamp.
How to use
See the plugins/cluster-api/README.md for installation and usage instructions.
Developed during LFX Mentorship
This plugin was developed as part of the CNCF LFX Mentorship program under the Headlamp project. The mentorship provided an opportunity to work closely with the Headlamp community while building features to improve the Cluster API management experience.
The focus was not only on implementing features but also on understanding real-world usability challenges around Cluster API operations. Discussions with mentors and community members helped shape the plugin's direction, improve the user experience, and prioritize features most useful to platform teams.
The mentorship also provided valuable experience contributing to large open-source projects: collaborating with maintainers, participating in design discussions, handling release feedback, and iterating on features based on community input.
Work on the plugin is ongoing, with additional improvements and features planned beyond the initial Alpha release.
Feedback and questions
This is an Alpha release, and community feedback directly shapes what comes next.
- Bug reports: Open an issue
- Feature requests: Start a discussion
- Contributing: PRs are welcome
- Kubernetes Slack: Join the #headlamp channel for questions and discussion
25 Jun 2026 10:00pm GMT
Inspect Volcano workloads faster with Headlamp
Volcano is a cloud native batch scheduler for Kubernetes, built for high-performance computing, AI/ML, and other batch workloads.
Headlamp is an extensible Kubernetes web UI. With its plugin system, Headlamp can surface APIs and workflows beyond the built-in Kubernetes resources. The Volcano plugin brings core Volcano resources into Headlamp so you can inspect workload state, queue behavior, and gang scheduling details in one place.
Kubernetes was originally designed around long-running services, where applications are expected to start and remain available over time. Batch, AI/ML, and HPC workloads often behave differently: jobs arrive dynamically, compete for limited resources, and may need multiple workers to start together before useful work can begin.
Volcano extends Kubernetes with concepts such as queues, priorities, quotas, and gang scheduling. Instead of treating every Pod independently, Volcano schedules workloads with awareness of the job as a whole and the resources it needs to make progress.
To make these workloads easier to operate and troubleshoot, the Volcano plugin brings that scheduling context directly into Headlamp.
Watch this short walkthrough to see the Volcano plugin in Headlamp:
Visual context helps teams understand Volcano jobs, queues, and PodGroups faster
Working with Volcano often means moving across several related resources while trying to understand a batch workload. You might start with a Job, then look at the related PodGroup, inspect the Pods behind it, check the Queue, and finally return to the Job again. All of that is possible with CLI tools like kubectl and the Volcano CLI, but it can become fragmented very quickly.
The Volcano plugin for Headlamp makes that workflow easier by bringing the key resources together in a single UI. Instead of reconstructing relationships manually, you can move directly between Jobs, Queues, PodGroups, Pods, and events from the same interface.
Volcano introduces its own resources on top of core Kubernetes objects:
- Job
- Describes a batch workload as a set of tasks and the Pods they create.
- Queue
- Divides cluster capacity between teams or workloads using quotas and priorities.
- PodGroup
- Ties a group of Pods together so the scheduler can treat them as a single unit for gang scheduling.
The plugin surfaces all three resource types directly in Headlamp, providing dedicated list and detail views for each of them under a Volcano section in the sidebar.
Jobs: workload status, actions, and logs
The Job view is the center of the plugin experience. In the list view, you can quickly understand the basics of a workload, including its status, queue, running versus minimum-available values, task count, and age.
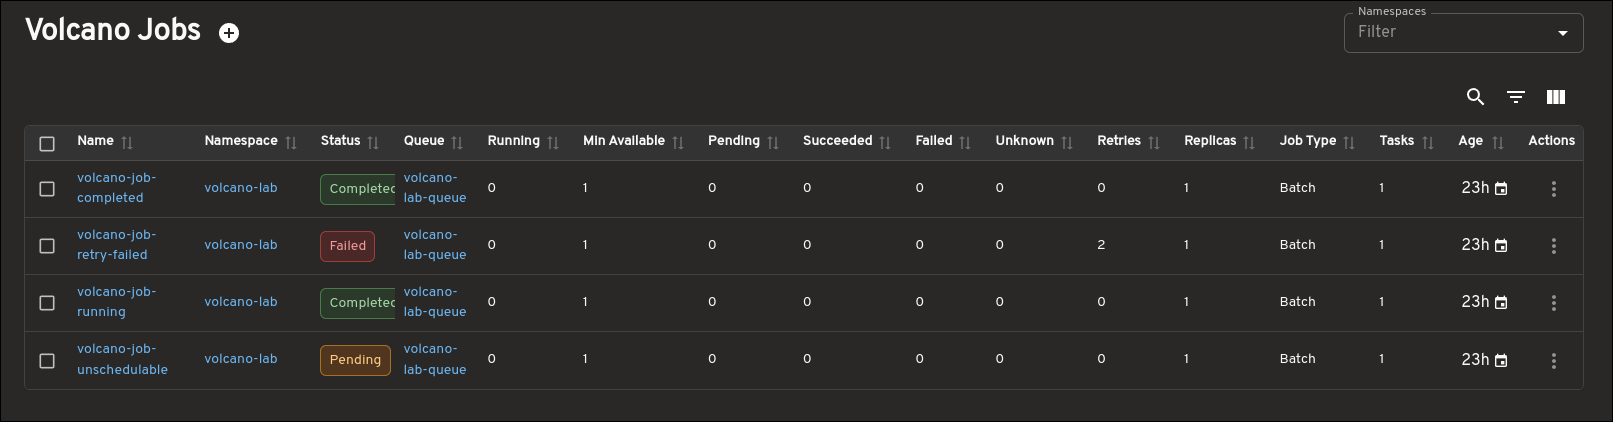
The detail view goes further by surfacing the information you usually need while debugging a Job: task details, Pod status, related Queue and PodGroup links, conditions, events, and more. Instead of forcing you to jump between several CLI commands, the plugin keeps that context together in a single page.
The Job page also adds supported lifecycle actions for appropriate states, including Suspend and Resume, so you can act on a Job directly from the UI.
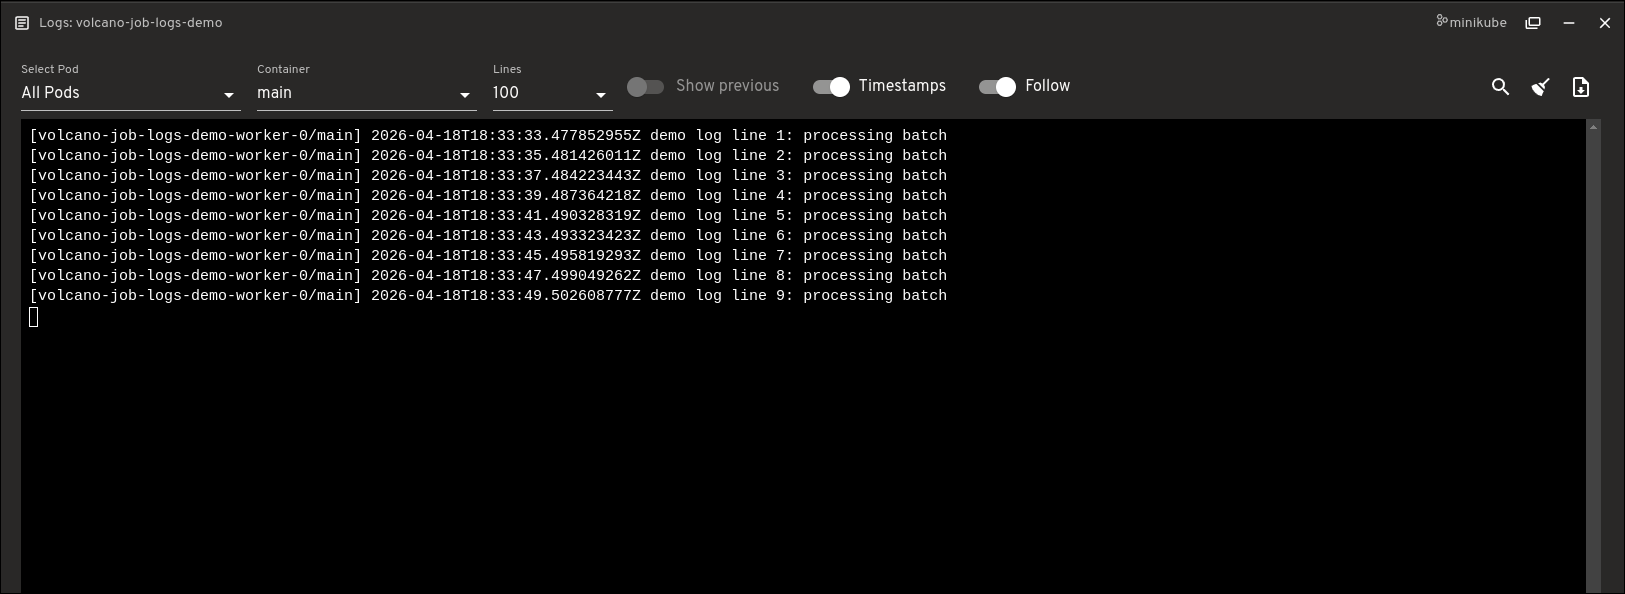
Another useful addition is direct Job logs access. You can open logs for Pods created by a Volcano Job without leaving the Job detail page. The logs viewer supports both single-Pod and all-Pods views, along with container selection and common log controls such as line count, previous logs, timestamps, and follow.
Queues: scheduling capacity and resource context
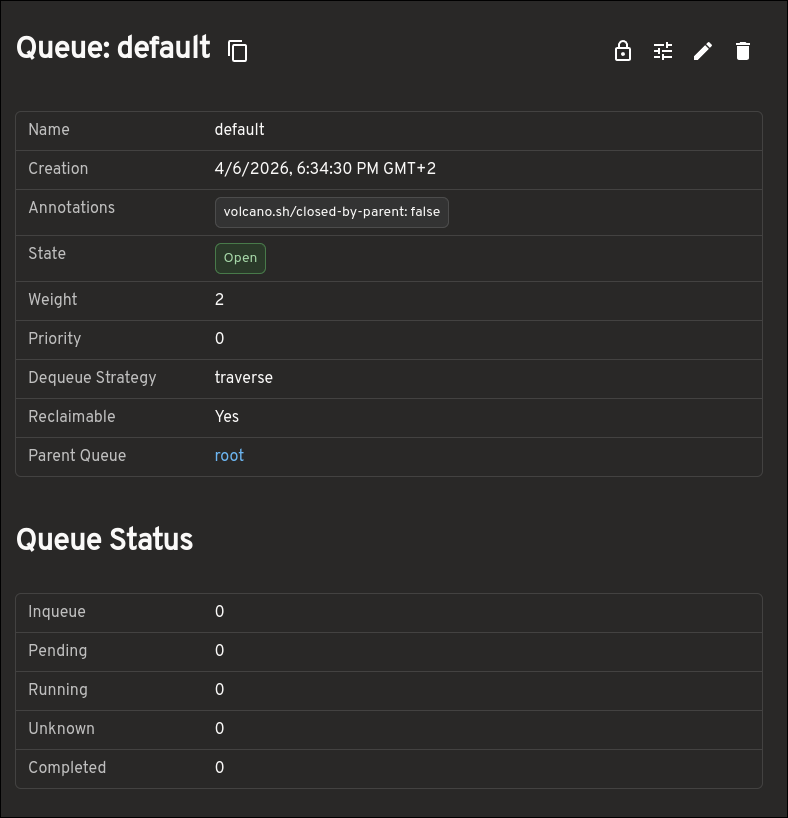
The Queue view provides much more than a small set of top-level fields. It helps you understand how resources are being allocated and constrained by surfacing capacity, allocated resources, deserved and guaranteed resources, reservation details, child queues, and more.
This makes the Queue page much more useful when trying to understand how resources are being shared and limited across queues.
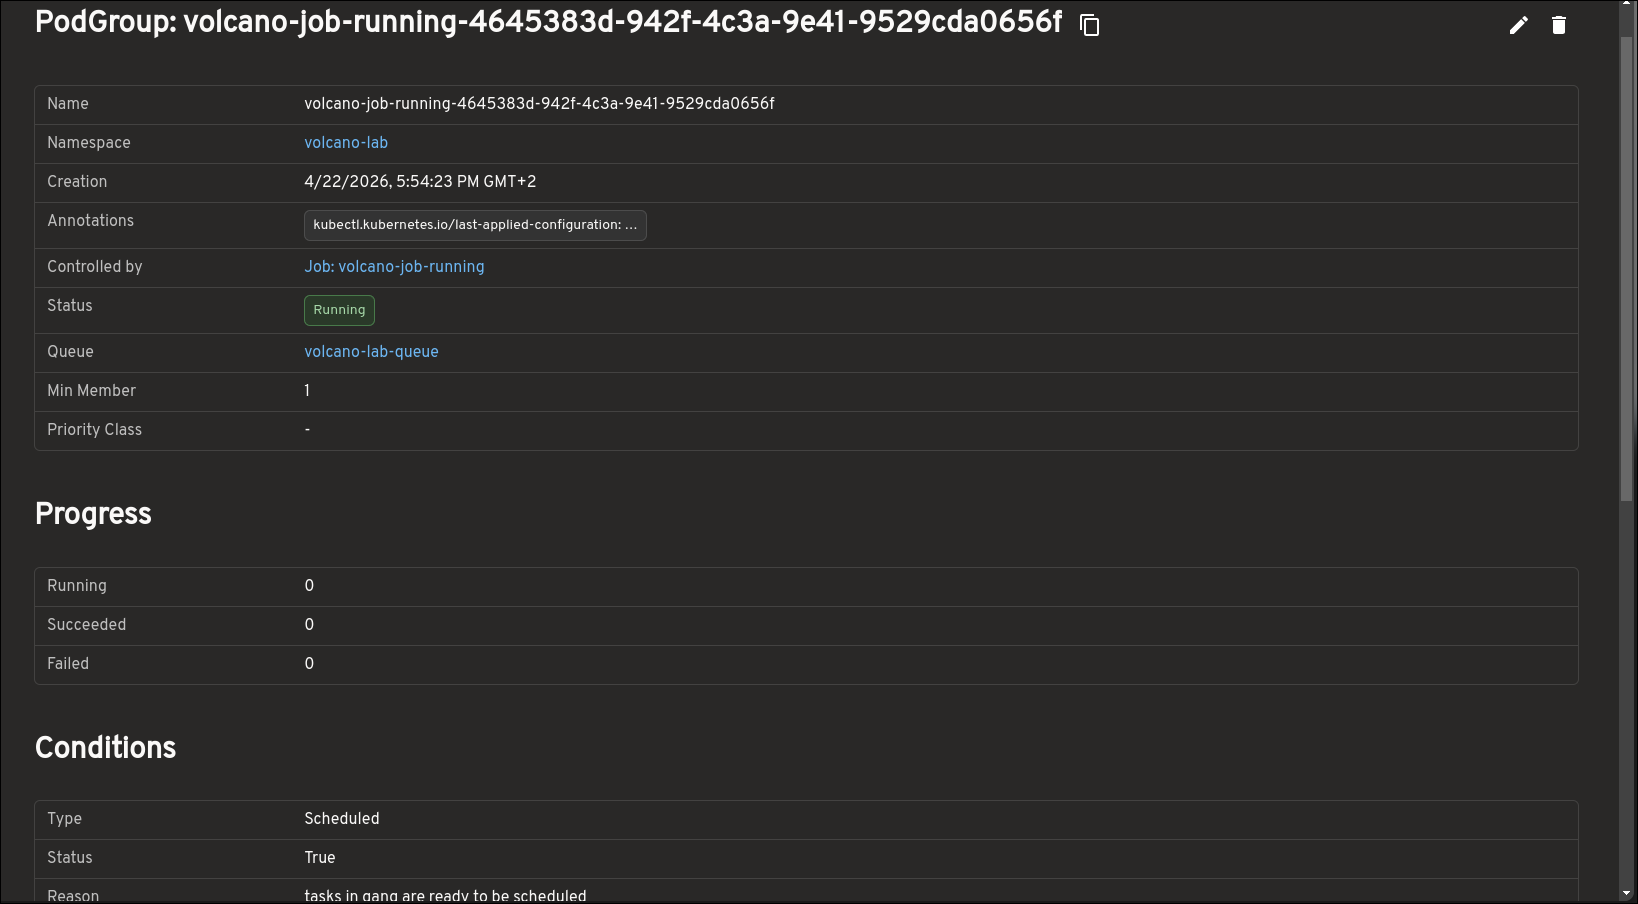
PodGroups: gang scheduling state and blockers
PodGroups are central to understanding gang scheduling in Volcano, and the plugin makes that state easier to inspect. The PodGroup view highlights progress, conditions, minimum resource requirements, and more.
This also gives you a clearer picture of whether a workload is blocked because it has not yet met the scheduling conditions required to run as a group.
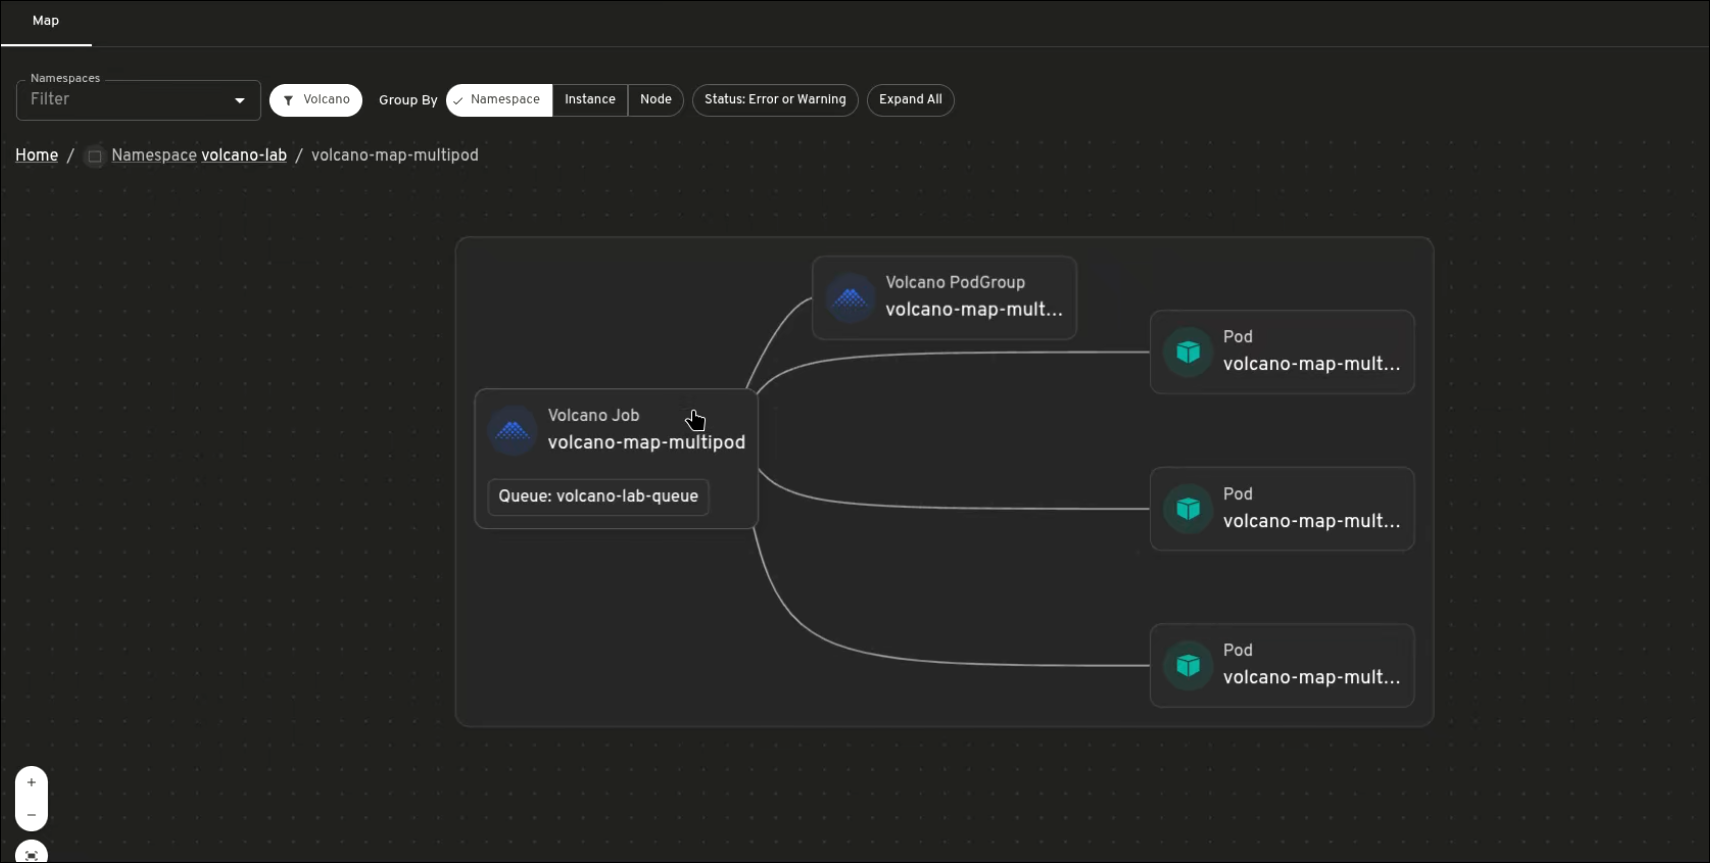
Map view: jobs, queues, PodGroups, and pods in one place
The map view shows how Volcano resources are connected. Instead of inspecting each resource separately, you can see how Jobs, PodGroups, Queues, and Pods relate to one another.
This is especially useful when a workload is pending or not progressing as expected. The map can show the Job, its related PodGroup, the Pods created for the workload, and the Queue context around it. Warning and error states also make it easier to spot resources that need attention.
Why use this alongside CLI tools
The plugin is not trying to replace kubectl or the Volcano CLI. Those remain important for automation, scripting, and raw object inspection. What the plugin improves is the interactive troubleshooting experience: discovering related resources more quickly, understanding structured detail pages, and moving from scheduling state to runtime output without switching tools constantly.
What's next
This work brings the main Volcano workflow into Headlamp, including Jobs, Queues, PodGroups, and the map view. Possible future work includes Prometheus integration, richer scheduling insights, and more workflow-oriented visibility across Volcano workloads.
Try it and share feedback
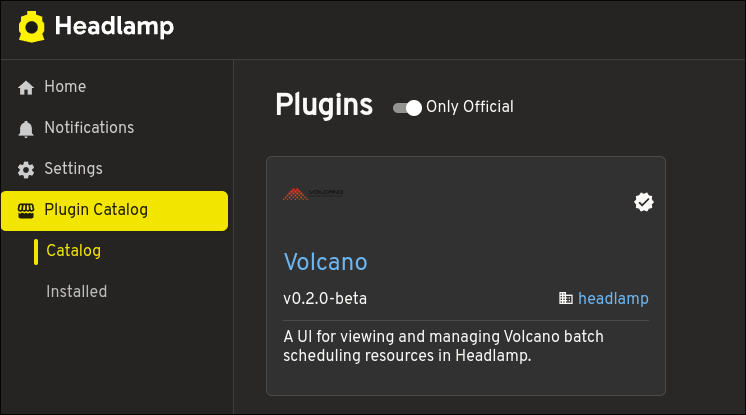
To try the plugin:
- Install Headlamp.
- Open the Plugin Catalog from the Headlamp UI.
- Search for Volcano.
- Install the Volcano plugin.
- Connect Headlamp to a Kubernetes cluster where Volcano is already installed.
If you have ideas, feature requests, or bug reports, open an issue in the Headlamp plugins repository. Feedback from real Volcano users will help shape what comes next.
25 Jun 2026 8:00pm GMT
See your serverless: introducing the Headlamp plugin for Knative
Headlamp is an open-source, extensible Kubernetes SIG UI project designed to let you explore, manage, and debug cluster resources.
Knative brings serverless workloads to Kubernetes, handling traffic routing, autoscaling, and revision management so teams can deploy and iterate without fighting infrastructure. But operating Knative workloads day-to-day can be difficult, there's still a lot of jumping between the kn CLI, kubectl, and the Kubernetes UI to get a full picture of what's running.
We built the Headlamp Knative plugin to bridge that very gap, allowing operators to inspect, understand and act on their workloads all from a single place. This plugin was built as part of the LFX mentorship. Here's a tour of what we shipped.
Here is a short walkthrough of the Knative plugin for Headlamp:
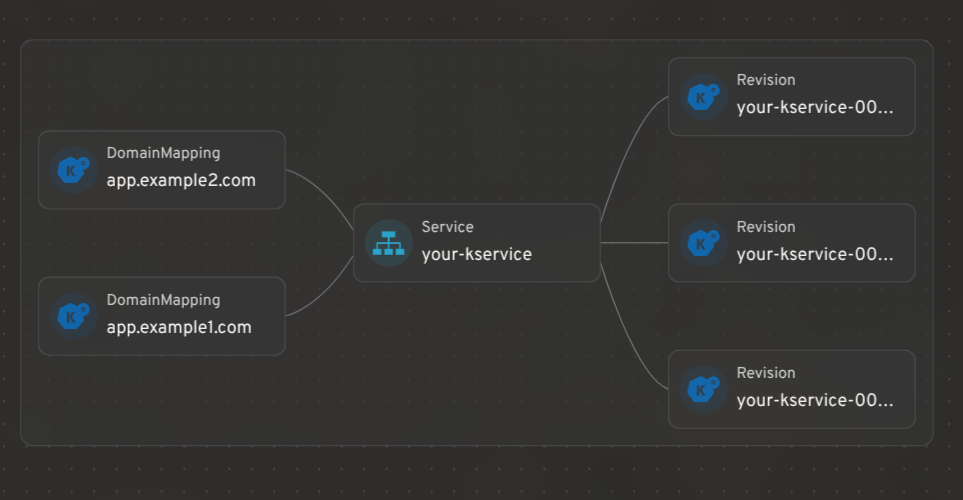
Integrating Knative resources with Headlamp's map view
Headlamp's resource mapping works for Knative CRDs too. You can see how KServices, Revisions, and DomainMappings relate to each other in a single graph view.
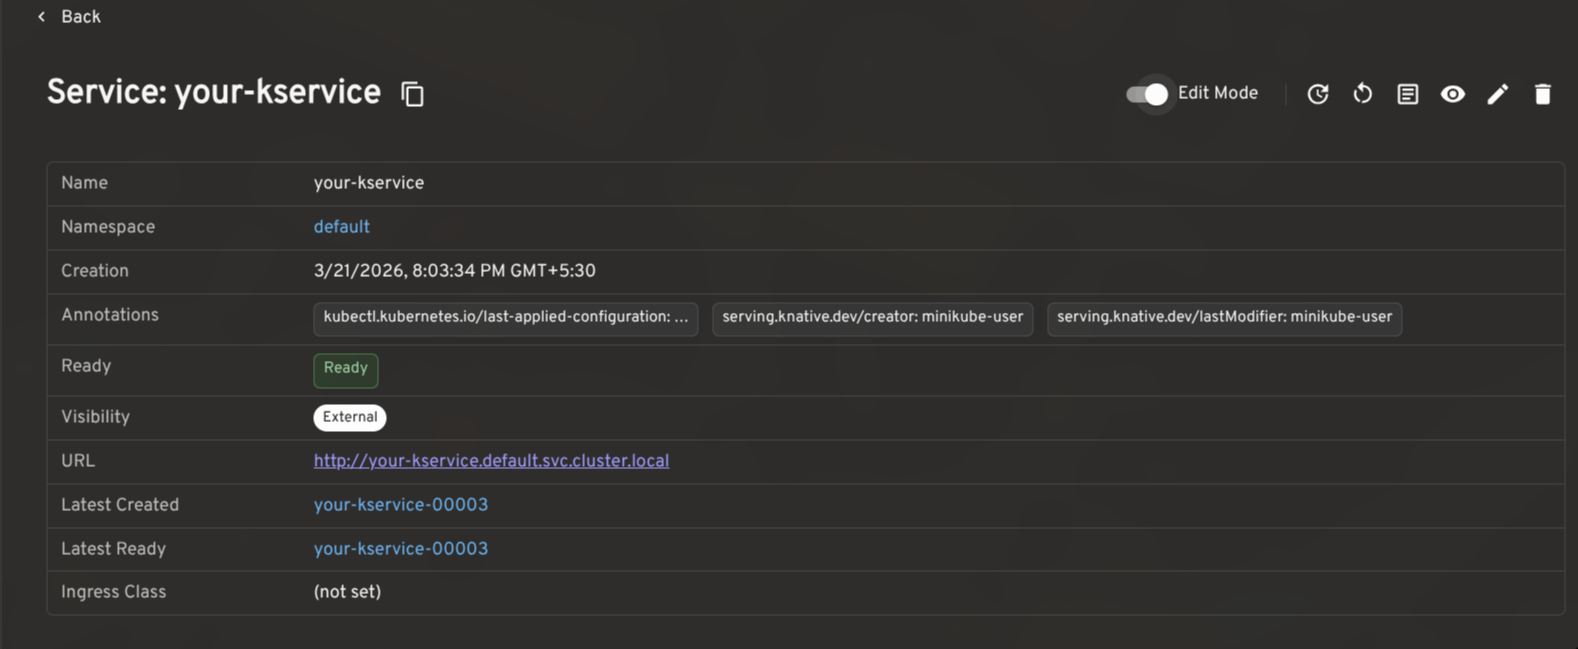
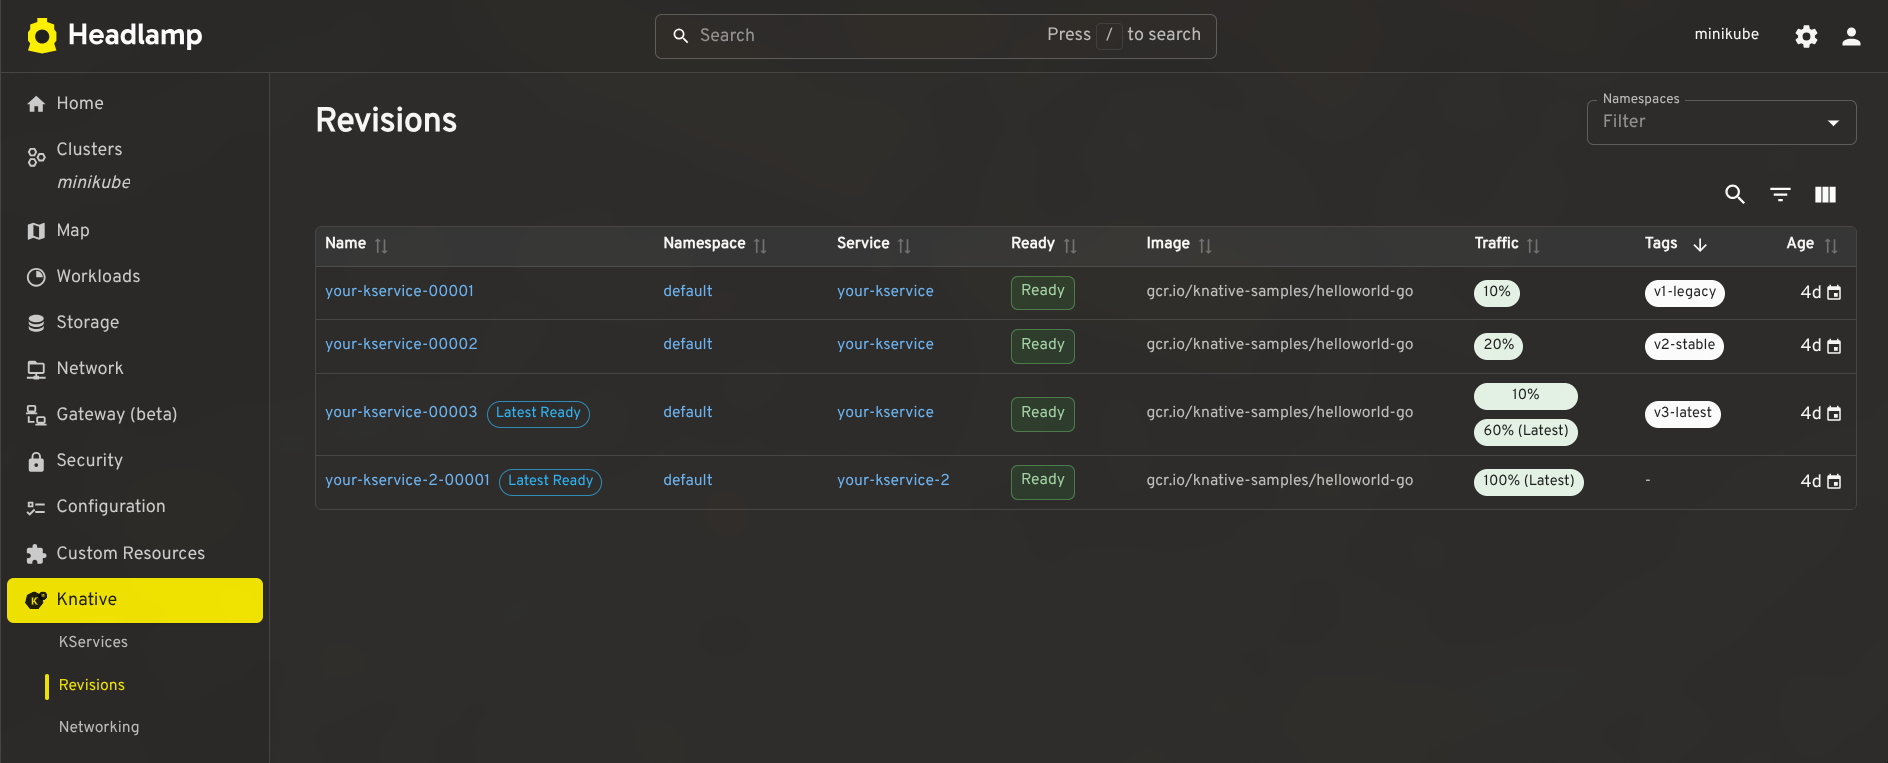
KService management: edit traffic splits, restart pods, and view logs
A KService is the top-level resource in Knative: it manages the lifecycle of Routes, Configurations, Revisions, and everything needed to run and expose your application.
The plugin gives KServices a full detail view with an Edit Mode toggle for making live changes to traffic splits, autoscaling annotations, and more. Common actions like viewing the YAML, opening logs, triggering a redeploy, or restarting backing pods are surfaced in the header, gated by your current RBAC permissions.
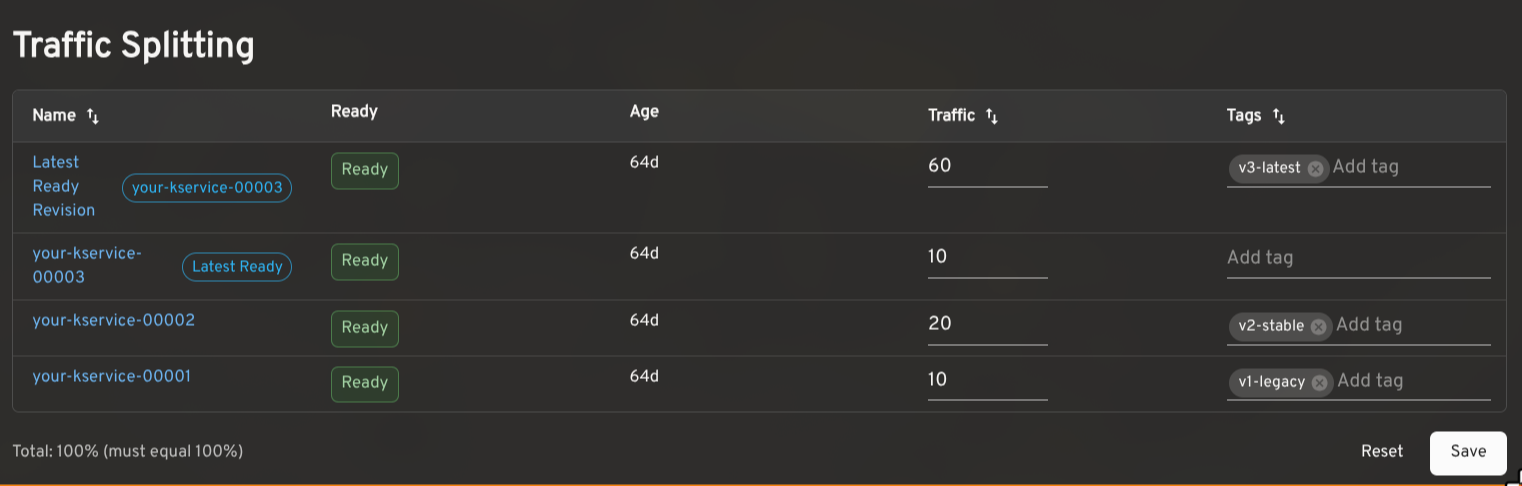
Traffic splitting: route across revisions for gradual rollouts and testing
Knative makes it possible to route traffic across multiple Revisions of the same service. This is useful for canary releases, gradual rollouts, tagged preview URLs, and A/B testing.
The plugin shows the traffic assigned to each Revision, the latest ready Revision, readiness status, age, and configured tags. In edit mode, you can adjust percentages and tags inline. The plugin validates that traffic sums to 100% and that tags are unique before saving. Tagged routes with a reported URL render as clickable links.
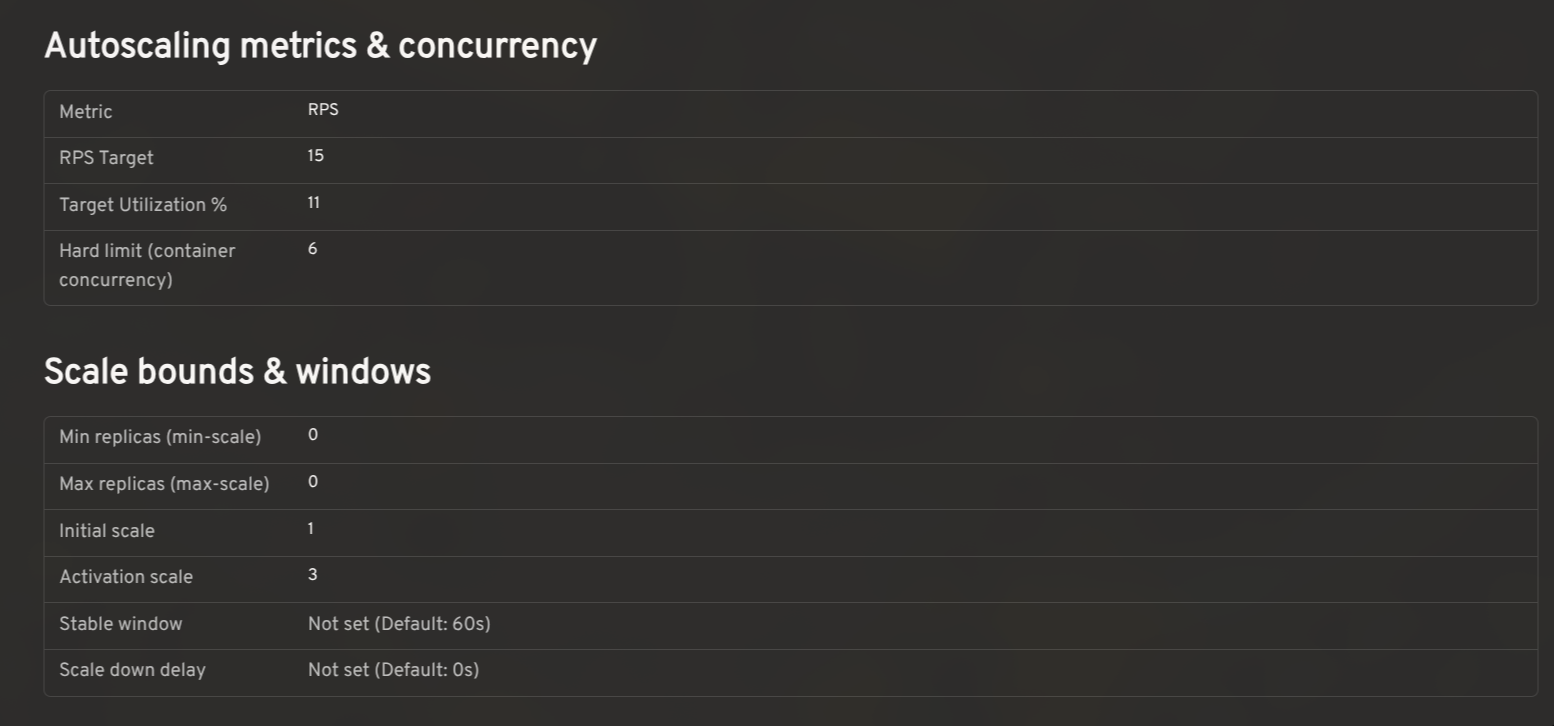
Autoscaling configuration: view effective settings and cluster defaults
Knative's autoscaler supports a range of settings: concurrency targets, target utilization, RPS targets, min/max scale, initial scale, stable window, scale-down delay, and more. The effective value for any workload is a combination of KService-level annotations and cluster-wide ConfigMaps.
The plugin reads config-autoscaler and config-defaults and shows the effective configuration per KService in context, so you can see at a glance whether a setting is explicitly configured or falling back to the cluster default.
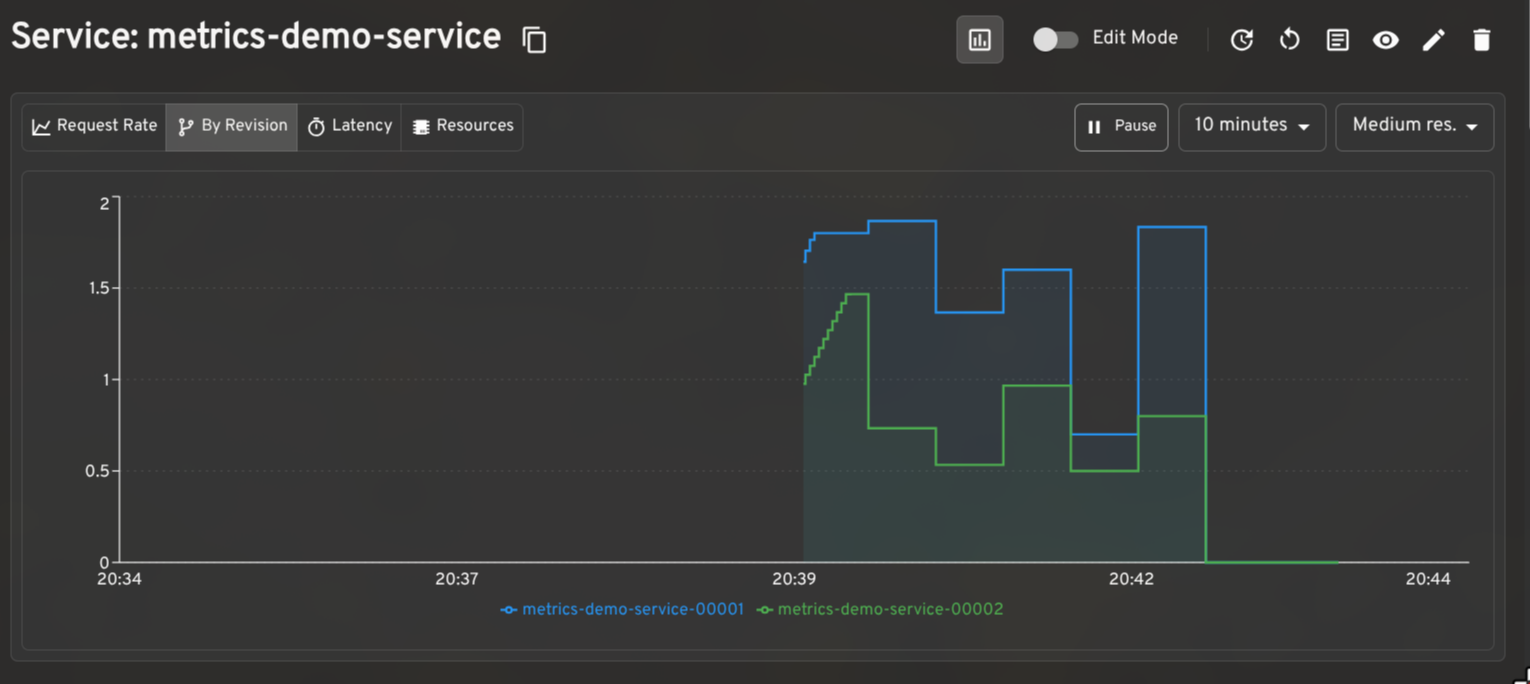
Prometheus metrics: monitor request rates, latency, and resource utilization
When paired with the Prometheus plugin for Headlamp, the plugin renders request rate, latency, and resource utilization graphs on KService and Revision detail pages. The per-revision request rate breakdown is particularly useful when validating a traffic split in progress.
Dashboard for other CRDs
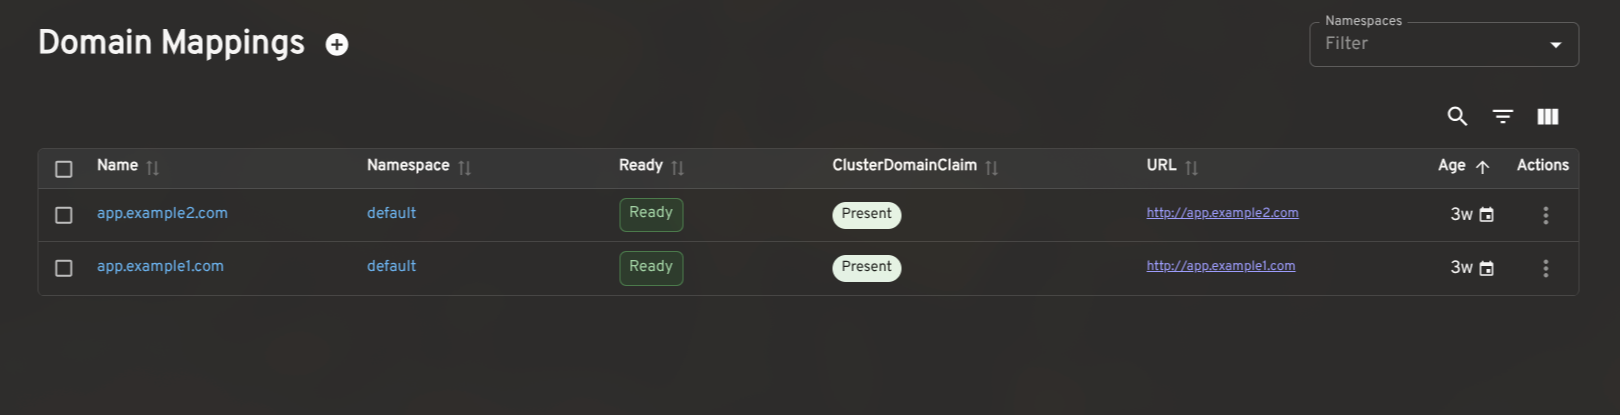
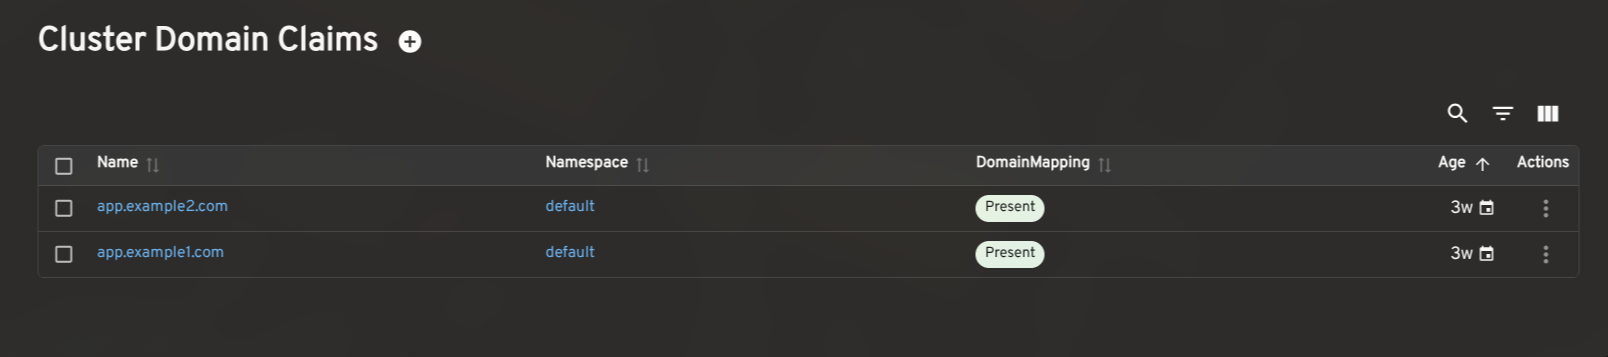
The plugin also includes list and detail views for Revisions, DomainMappings, ClusterDomainClaims, and a cluster-level Networking overview (reading config-network and config-gateway to surface the effective ingress class, gateway settings, and backing services). These give operators a complete picture of Knative's state without leaving Headlamp.
How to install the Knative plugin in Headlamp
- Make sure Knative is installed in your cluster.
- In Headlamp Desktop, open the Plugin Catalog, search for Knative, and click Install.
- Reload Headlamp, a new Knative entry will appear in the sidebar.
For development or source-level setup, see the Knative plugin README. The current release is 0.3.0-beta.
Share your feedback
We'd love feedback from Knative operators and users. If you hit a bug or want support for a workflow we haven't covered, please open an issue. You can also find us in the Kubernetes Slack #headlamp channel.
25 Jun 2026 6:00pm GMT
24 Jun 2026
Kubernetes Blog
Spotlight on WG Device Management
The rising popularity of AI, Edge, and Telecommunications workloads on Kubernetes has led to new requirements for hardware management. We now need hardware specification beyond CPU time and memory allocations. This includes allocating GPUs, TPUs, network interfaces, and other hardware, sometimes after pod start and occasionally through time-sharing.
Efficiently managing this specialized hardware is the mission of the Device Management Working Group. Their cornerstone project, Dynamic Resource Allocation (DRA), recently graduated to GA, marking a fundamental shift in how the project handles hardware-intensive workloads at scale.
In this spotlight, we sit down with working group chairs Kevin Klues, Patrick Ohly, and John Belamaric to discuss the limitations of the legacy device model, the NP-hard challenges of scheduling, and how they're building a more programmable, hardware-aware future for Kubernetes.
Introducing Device Management
Natalie Fisher: Can you introduce yourself, your role, and how you got involved in the Device Management Working Group?
Kevin Klues: My name is Kevin Klues. I am a Distinguished Engineer at NVIDIA. I have been a co-chair of the device management working group since its inception at Kubecon EU 2024. I have also been involved with DRA (the working group's primary deliverable) since its inception in 2019 / 2020. I have also been a kubelet maintainer since 2019, with a focus on its device manager, CPU manager, and topology manager subcomponents. The challenges we saw with using these components for workloads that relied on external accelerators (e.g., GPUs) are what triggered us to start working on DRA in the first place.
Patrick Ohly: I am a Principal Engineer at Intel. In Kubernetes, I am a Tech Lead for SIG Testing and SIG Instrumentation and co-chair of the Device Management WG. I was co-chair of the WG Structured Logging and a member of the Steering Committee. Some of my early contributions to Kubernetes include ephemeral CSI volumes and storage capacity tracking, so I had some experience with API design, implementation, and scheduling. We knew that introducing a major new API for accelerators would be hard. Somewhat foolishly, I accepted that challenge in 2020, wrote the initial DRA KEP (now known as "classic DRA") and implemented most of it, then started over with a second KEP for today's "structured parameters DRA". Initially, it was an uphill battle to convince maintainers that this work was necessary. It was only around 2023 that interest in DRA picked up, leading to the formation of the working group.
John Belamaric: I am a Senior Staff SWE at Google, and the third co-chair of WG Device Management, also since its inception. I am also a co-chair of SIG Architecture since 2019. As Patrick mentioned, in late 2023, interest in DRA really picked up. The initial implementation, made autoscaling very challenging, and so there was some concern in the community about advancing it to beta. I got involved to try to help address some of those concerns, and the three of us, along with Tim Hockin, worked hard over the next few months to build a consensus around a new design. To facilitate this collaboration, we formed the working group after discussion at KubeCon in Paris in 2024.
The problem and the solution
The working group emerged from a fundamental rethink of how Kubernetes interacts with specialized hardware. At the heart of this evolution is Dynamic Resource Allocation (DRA). Rather than treating devices as simple integers, DRA provides a structured framework that breaks device management into four distinct stages:
- Modeling: Vendors use the ResourceSlice API to advertise the granular capabilities and capacity of their hardware.
- Requesting: Users define their specific hardware needs-such as GPU memory or interconnect requirements-through the
ResourceClaimAPI. - Scheduling: The Kubernetes scheduler uses these APIs to match workload requirements against available hardware intelligently.
- Actuation: Once a match is made, the system handles the "handshake" that prepares and secures the device for the Pod's use.
NF: For readers who may not be familiar, what is the Device Management Working Group, and what problems is it trying to solve?
KK: The Device Management Working Group was chartered to enable simple and efficient configuration, sharing, and allocation of accelerators and other specialized hardware across Kubernetes workloads. Think GPUs, TPUs, FPGAs, and similar devices that don't fit neatly into Kubernetes' traditional resource model.
The problem we set out to solve is that the legacy Device Plugin API (which has been the primary mechanism for exposing hardware accelerators in Kubernetes) is fundamentally limited. It treats devices as opaque integers: you can request "2 GPUs," but you can't say anything meaningful about which GPUs you need, how they should be connected to each other, whether they can be shared, or how they should be partitioned. That was fine for simple cases, but modern AI/ML workloads are anything but simple. They span multiple nodes, require specific interconnect topologies, and increasingly need to share or partition hardware dynamically.
The working group's primary deliverable is Dynamic Resource Allocation (DRA), a new framework that replaces the rigid device plugin model with a flexible, declarative API. With DRA, workloads can describe their hardware requirements (e.g., GPU type, memory capacity, interconnect topology, desired partitioning) and drivers can publish fine-grained device attributes that the scheduler can act on. DRA graduated to GA in Kubernetes 1.34, and the ecosystem around it (e.g., drivers, tooling, and new API extensions) is growing rapidly.
PO: As Kevin said, the working group was formed around the existing effort to develop DRA. The initial work was done with only a handful of people actively involved, and perhaps also could only be done successfully in such a setup. But because it touches on so many different areas of Kubernetes, we also needed a place to discuss that and get the broader community of Kubernetes maintainers, device vendors, and, to a lesser extent, also end-users involved. The working group provides that place, with regular meetings online (one slot for Americas/EMEA, one for EMEA/Asia) and at KubeCon.
JB: DRA is the first problem the WG has addressed. It is focused on selection, allocation, and configuration of the devices. We broke the problem down into four parts: how does the vendor model the device and advertise capacity, how does the user request it, how do we schedule that request on top of the advertised capacity, and how do we actuate that result (that is, how do we make the device ready and available to the Pod).
One thing that is fundamental to the approach we took is an awareness of the incredible diversity of hardware and the rapid rate of change in the hardware industry. We knew that we couldn't keep up with the change if the Kubernetes APIs had to change for every type of hardware. Instead, we created a general approach where we address the hardware aspects that are important to Kubernetes. What we have done so far is focus on the scheduling and configuration aspects of devices. We build a device modeling API (the ResourceSlice API) that vendors use to model the scheduling characteristics of their devices, and allow users to pass through arbitrary configurations to those devices. By doing this, Kubernetes can be "programmed" to understand these aspects of the devices, without needing to be modified.
But DRA, as it stands right now, is very focused on scheduling. There are other aspects of Device Management that are in scope for the WG. In particular, we are looking into device failure detection and mitigation, and whether there is some better support we can build into Kubernetes to help.
Also, as Kevin alluded to, devices are often allocated and used in groups, rather than individually. Choosing the right devices to work together in a group depends on how they are interconnected; for example, NVIDIA GPUs may be in an any-to-any fabric arrangement in an NVLINK domain, whereas TPUs may have a 3D torus interconnect. This affects the "selection, allocation and configuration" of devices, and we have a lot more work to do to address these use cases.
A cross-SIG effort
Because device management touches scheduling, node operations, autoscaling, networking, and API design, the work naturally spans multiple SIGs across the Kubernetes project.
NF: How does collaboration across these SIGs work in practice, and why is it necessary?
KK: Device management touches nearly every layer of the Kubernetes stack, which is why the working group was chartered as a cross-SIG effort from the start. We have five stakeholder SIGs: sig-node, sig-scheduling, sig-autoscaling, sig-network, and sig-architecture.
In practice, the working group serves as a coordination layer. We don't own code directly; instead, our deliverables take the form of KEPs and implementations that live in the respective SIGs. What we provide is a unified forum where the people building the scheduler, the kubelet, the autoscaler, and the network plane can design together rather than in isolation.
Why is this necessary? Consider a simple example: a user requests a set of GPUs that need to communicate via NVLink. That requirement involves the scheduler (place the pods on the right nodes), the kubelet (configure the devices and expose them to the container), and potentially autoscaling (provision the right node type if none exists).
If those three groups design independently, you end up with inconsistent abstractions, duplicated logic, and integration bugs that only surface in production. The working group ensures that a single coherent API and data model flows through all of these components.
The cross-SIG model also means that design decisions are reviewed from multiple angles. Someone from sig-scheduling will catch scheduler complexity that a sig-node contributor might overlook, and vice versa. It slows down individual decisions slightly, but produces much more robust outcomes.
Current focus areas
With DRA now generally available, the working group's focus has expanded to enable more advanced scheduling models, shared semantics, operational visibility, and support for increasingly complex hardware topologies.
NF: What are some of the key initiatives or deliverables the working group is currently focused on?
KK: We maintain a project board at Kubernetes Project Board with real-time tracking of our initiatives and their progress.
PO: The scope and feature set of core DRA were intentionally limited to enable graduation to GA within a reasonable time. Additional KEPs add more features, on their own schedule. Those fall roughly into three categories:
- Extend the expressiveness of DRA to support more complex devices and scheduling scenarios.
- Support day two operations like health monitoring.
- Improve multi-node support, primarily by integrating with workload-aware scheduling.
In addition to the project board, we also maintain a table which summarizes all the KEPs which are currently in flight. This is the status for 1.36; more are likely to be added for 1.37:
| KEP | Description | Release | ||||
|---|---|---|---|---|---|---|
| 1.32 | 1.33 | 1.34 | 1.35 | 1.36 | ||
| 4381 | DRA: Structured Parameters | Beta | Beta | Stable | ||
| 5004 | DRA: Extended Resource Requests via DRA | Alpha | Alpha | Beta | ||
| 4817 | DRA: Resource Claim Status | Alpha | Beta | Beta | Beta | Beta |
| 5018 | DRA: Namespace Controlled Admin Access | Alpha | Beta | Beta | Stable | |
| 5055 | DRA: Device Taints and Tolerations | Alpha | Alpha | Alpha | Beta | |
| 4816 | DRA: Prioritized Alternatives in Device Requests | Alpha | Beta | Beta | Stable | |
| 5075 | DRA: Consumable Capacity | Alpha | Alpha | Beta | ||
| 4815 | DRA: Partitionable Devices | Alpha | Alpha | Alpha | Beta | |
| 5304 | DRA: Attributes Downward API | Alpha | ||||
| 5729 | DRA: ResourceClaim Support for Workloads | Alpha | ||||
| 4680 | Resource Health Status in Pod Status | Alpha | Alpha | Alpha | Alpha | Beta |
| 5517 | DRA: Native Resource Requests | Alpha | ||||
| 5677 | DRA: Resource Availability Visibility | Alpha | ||||
| 5007 | DRA: Device Binding Conditions | Alpha | Alpha | Beta | ||
| 5491 | DRA: List Types for Attributes | Alpha |
NF: One of the core challenges is efficient device utilization and sharing. What progress is being made in this area?
JB: Good question. One way to think about it is what we are doing in the two primary APIs: ResourceClaim and ResourceSlice.
The ResourceClaim API is how the user asks for devices. We have built some features that allow the user to be more flexible in their requests. For example, instead of asking for a specific model of GPU, they can ask for a GPU with at least a certain amount of memory. Or they can ask for a list of alternatives: "I'd like one A100 (80GB) GPU, but if you don't have it, I'll take 2 A100 (40 GB) GPUs." This gives the scheduler some options to satisfy the request, which can lead to better obtainability and utilization of hardware that otherwise would not be selected.
The ResourceClaim API allows users to explicitly share devices. You can point multiple containers (in the same or different Pods) at a ResourceClaim; this allows the devices allocated by that claim to be used in all of those containers, if the device supports it.
The ResourceSlice API is how vendors model and advertise their devices. This is where we implement support for other sharing models. For example, we have a way to represent "overlapping partitions", enabling the scheduler to dynamically select a MIG partition, and make any overlapping MIG partitions unavailable automatically. This works well in combination with a request like "give me any GPU with 20GB or more of memory" - the scheduler can satisfy that with a MIG or a real GPU.
Some features require changes in both. We have another sharing method we call "consumable capacity". In the explicit sharing case described above, a user needs to point containers at the same ResourceClaim; there is one ResourceClaim shared amongst several containers and Pods. With consumable capacity, the device sharing works more like how Pods share a Node. The user creates a ResourceClaim that asks for a certain amount of resources, for example, "I need a NIC with 2Gbps of bandwidth". The scheduler knows that there is a NIC with 40Gbps of bandwidth available, and so it allocates 2Gbps out of that 40Gbps and gives it to that ResourceClaim. In this case, each Pod has its own ResourceClaim, but the underlying device is shared between those claims. It's up to the on-node DRA driver to properly set up the device for this sort of sharing (in the NIC case, likely by creating a subinterface). We call this "platform-mediated sharing" to differentiate it from the explicit "user-mediated sharing".
Real-world impact
While much of the work is deeply technical, the underlying goal is practical: enabling Kubernetes to better support real-world AI/ML and hardware-intensive workloads at scale.
NF: What are the biggest challenges users face today when running hardware-intensive workloads (like AI/ML) on Kubernetes?
PO: Such workloads depart from traditional container workloads in several ways: they may consist of multiple communicating pods which all need to run at the same time ("gang scheduling"). They are often long-running and expensive to initialize, and their performance is sensitive to where they run (topology within a node and interconnects between nodes for multiple pods). The Kubernetes scheduler traditionally has not supported either of this well because it schedules one pod at a time and is unaware of the topology within a node. Several external schedulers try to fill this gap, which often isn't ideal, in particular when the Kubernetes scheduler schedules other pods to the same cluster.
NF: How should platform engineers think about device management when designing their Kubernetes platforms?
JB: We're still learning here, but one idea of DRA is to enable a shift to more "requirements driven" specifications. This can allow less coupling between end users that write the workload specification and the cluster administrators that set up the clusters. Instead of agreeing on labeling conventions and requiring users to understand the cluster topology, the users can specify what their workload needs, and the scheduler can figure out how to satisfy it. If we can make this work, it can make even complex workloads more portable across clusters.
Challenges and trade-offs
As with many areas of Kubernetes, increasing flexibility and expressiveness also introduces new layers of complexity, particularly around scheduling and optimization.
NF: What are some of the hardest technical challenges the working group is tackling today?
PO: There's an inherent conflict between flexibility and scheduling complexity. The current implementation is focused on finding some solution that satisfies the requested resources, but it's not necessarily the best one, whatever "best" means, which is also not always clear. The other big challenge is exposing node-allocatable resources (RAM, CPU) as devices with additional metadata; this is necessary to fine-tune scheduling of workloads which need perfect alignment on a node for optimal performance.
JB: Patrick's list is good. Complex device modeling is hard, and making sure that we build the right semantics such that they apply to lots of different hardware is always tricky.
On top of that, scheduling in general is very complex and is an NP-hard problem. All the metadata and flexibility DRA adds gives the scheduler more options, which has pros and cons. More options are helpful if you are constrained in your choices, as it means you can schedule something that you otherwise could not. But it also means it is even harder to find an optimal solution when there are many possibilities in a given cluster. DRA works well in our common use cases so far, but we have a lot of work to do to improve the optimality of the chosen scheduling solution and ensure the performance of making that choice.
Looking ahead
Despite the challenges, contributors across the working group remain excited about the pace of innovation and the growing community forming around device management in Kubernetes.
NF: Looking ahead, what are you most excited about in the future of device management in Kubernetes?
KK: NVIDIA recently donated its DRA driver for GPUs to the Kubernetes project. I'm personally excited for more community members to start contributing to the project and defining its future direction.
PO: For me, it's primarily the number of new contributors and people stepping up to help out. This poses new challenges around reviewing proposals and helping developers get those implemented and merged. It's nice and rewarding to see others succeed, and it bodes well for the future because more people are familiar with the topic.
JB: I am excited about a lot of things. The community really has grown and has so many interesting features in the works to enable modeling of more complex devices, and to better model multi-node devices.
I am really excited to see the creative ways people will use these APIs. They were primarily designed to address "devices", but just like how "everything is a file" in Unix/Linux, the APIs themselves are quite flexible as to what they model. They really build out a more programmable scheduler, which can have interesting applications. For example, I recently prototyped using DRA to schedule pods to nodes where a large AI model is already locally cached. It's really quite flexible, and I have great confidence in the creativity of our community, so I think we'll see some unexpected solutions in the ecosystem.
Getting involved
NF: How can contributors get involved with the Device Management Working Group?
KK: The easiest first step is to join our mailing list at wg-device-management@kubernetes.io. Subscribing will automatically add calendar invites for our biweekly meetings to your calendar.
We have two meeting slots to accommodate different time zones:
- Europe/Americas: Tuesdays at 8:30 AM PT (biweekly)
- Asia/Europe: Wednesdays at 9:00 AM CET (biweekly)
Meeting notes, agendas, and recordings are all publicly accessible (links available from Device Management page). You can get a feel for the work in progress before attending your first meeting.
On Slack, find us in #wg-device-management on the Kubernetes Slack workspace. That's the best place for quick questions or to introduce yourself.
For more hands-on contributions, the DRA Driver for NVIDIA GPUs is now a community project and a great place to start. It's a real-world, production-grade implementation that the broader community is now shaping together.
We welcome contributors at all levels - whether you're interested in the API design, the scheduler internals, driver development, or documentation. Come say hello.
Summary
As Kubernetes evolves to support the AI/ML revolution and high-performance computing, the work happening within WG Device Management is becoming the foundation for how modern workloads are scheduled and operated at scale.
From the graduation of Dynamic Resource Allocation (DRA) to the next frontiers of health monitoring and topology-aware scheduling, this group is effectively rewriting the "handshake" between software and hardware.
If you're interested in shaping the future of hardware-aware orchestration, now is the perfect time to get involved. Whether you want to help refine the API, build out drivers, or improve documentation, the working group welcomes all levels of experience and perspectives from across the community.
24 Jun 2026 6:00pm GMT
15 Jun 2026
Kubernetes Blog
Spotlight on SIG Storage
In our ongoing SIG Spotlight series, we shine a light on the groups that keep the Kubernetes project moving forward. This time, we catch up with SIG Storage, the group responsible for persistent data, volume management, and the interfaces that connect Kubernetes workloads to the storage systems beneath them.
We spoke with Xing Yang, Co-Chair of SIG Storage and Software Engineer at VMware by Broadcom, about the SIG's history, the features shipping in recent Kubernetes releases, and where storage in Kubernetes is headed as AI workloads become the norm.
Introductions
Could you introduce yourself and share your role(s) within SIG Storage?
My name is Xing Yang, a software engineer at VMware by Broadcom. I'm a co-chair in SIG Storage, alongside another co-chair Saad Ali from Google. There are also two Tech Leads in SIG Storage: Michelle Au from Google and Jan Šafránek from Red Hat.
What first drew you to storage in Kubernetes, and how did you start contributing?
I have always been working in the storage domain, so SIG Storage was a natural place for me to get started when I began to learn Kubernetes. I started attending SIG Storage meetings, trying to figure out what I could do to help. This was before the first Container Storage Interface (CSI) release - lots of things were still evolving. It was a very exciting time.
What subprojects or areas do you actively maintain or review today?
I'm a maintainer in Kubernetes CSI. There are multiple CSI sidecars - such as csi-provisioner, csi-attacher, csi-resizer, and csi-snapshotter - that we need to release following every Kubernetes release. I'm also a co-chair for a Data Protection Working Group co-sponsored by SIG Storage and SIG Apps. Several features have come out of that WG aimed at filling gaps in data protection support within Kubernetes. One is Volume Group Snapshot, which provides crash-consistent group snapshots for multiple volumes used by an application. Changed Block Tracking (CBT) is another critical feature from the DP WG designed to support efficient backups.
About SIG Storage
For folks who are new: what is SIG Storage, in your own words? What problems in Kubernetes are you trying to solve?
SIG Storage is a Special Interest Group focused on how to provide storage to containers running in your Kubernetes cluster. We define standard interfaces so that a storage vendor can write a driver and have its underlying storage system consumed by containers in Kubernetes.
Why does Kubernetes need a dedicated storage SIG? What makes storage hard in a distributed system?
When Kubernetes was first introduced, it was meant for stateless workloads only. Container applications were regarded as ephemeral and therefore did not need to persist data. However, that changed drastically. Stateful workloads started running in Kubernetes, and we needed a dedicated SIG to tackle the associated storage challenges. PersistentVolumeClaims, PersistentVolumes, and StorageClasses were all introduced to provision data volumes for applications running in Kubernetes.
How did SIG Storage originally form, and how has its mission changed over time?
SIG Storage was formed to address the challenges of handling persistent data within Kubernetes. Initially, PersistentVolumes were implemented as in-tree plugins, and the SIG managed those plugins while developing core storage primitives like PersistentVolumes and PersistentVolumeClaims.
Container Storage Interface (CSI) was introduced later and played a crucial role in simplifying storage integration, enabling third-party storage providers to develop and maintain their own out-of-tree plugins without modifying Kubernetes core code.
With basic integration addressed by CSI, the SIG's mission expanded to include advanced storage features that leverage the new interface. The SIG has also expanded its scope to support object storage through the Container Object Storage Interface (COSI).
Current work and roadmap
What are the top features SIG Storage is actively working on right now?
The Data Protection WG has been working on a couple of exciting features:
-
VolumeGroupSnapshot is a Kubernetes feature enabling a crash-consistent, point-in-time snapshot of multiple PersistentVolumes simultaneously. This ensures data integrity for applications - like databases - that rely on multiple volumes by capturing all volumes in the group atomically, at the exact same point in time. It just moved to GA in Kubernetes v1.36.
-
CSI Changed Block Tracking (CBT) enables efficient, incremental backups. By allowing storage systems to report only the blocks that have changed since the last snapshot, it significantly reduces the amount of data that needs to be transferred. It just moved to Beta in Kubernetes v1.36.
Another feature worth highlighting is Container Object Storage Interface (COSI). COSI provides a standard interface for provisioning and consuming object storage buckets in Kubernetes - standardizing object storage for containerized applications much like CSI did for block and file storage. COSI is now transitioning to v1alpha2, with plans for promotion to Beta in a future release.
What recent work from SIG Storage do you consider a "win" for users?
The graduation of VolumeAttributesClass to GA in Kubernetes v1.34 is a major win for users managing stateful workloads. Previously, changing volume attributes like IOPS or throughput required out-of-band actions or disruptive operations. Now, users can dynamically tune storage properties such as IOPS or throughput directly through the Kubernetes API - scaling up for peak loads or down to optimize costs - without external processes or downtime.
VolumeAttributesClass enables dynamic modification of storage characteristics without recreating the volume. This completes the picture by allowing users to tune both capacity and other storage properties dynamically, just as they can now tune both CPU and memory for compute.
Looking ahead one or two releases, what's on the roadmap that people should watch for?
I'd like to draw attention to the Volume Health feature. This feature is designed to offer critical visibility into the operational status and integrity of persistent volumes. By enabling storage drivers and the Kubernetes control plane to report issues, it allows for proactive monitoring and identification of volume-related problems.
Currently, volume health information is reported via non-persistent events. We are actively investigating enhancements to this feature with the goal of supporting automated remediation capabilities in the future.
Are there areas where you'd really like more discussion or help from the community?
We always need help from the community to fix bugs, add tests, and help with reviews.
We'd also like to get feedback on the Alpha feature Mutable PV Affinity, which was introduced in Kubernetes v1.35. Use cases include migrating volumes from zonal to regional storage or migrating from one disk type to another.
Another topic is volume replication. It was raised at KubeCon Atlanta and has been discussed in the Data Protection WG. Community members interested in this topic are encouraged to join the DP WG meetings.
What are the biggest challenges users face today when running stateful workloads on Kubernetes?
While Kubernetes has moved stateful workloads - like databases and AI pipelines - into the mainstream, managing "state" in a system designed for ephemerality remains difficult:
-
Data Gravity and Storage Locality: Pods move in seconds, but data has gravity. If a node fails, a pod using local storage is stuck. Operators must decide whether the failure is transient or permanent - a high-stakes call. This is why we are enhancing the Volume Health feature to provide the visibility needed to automate recovery choices.
-
Day 2 Complexity: Setting up a database is easy; maintaining its health over time is the real challenge. Standard Kubernetes objects like StatefulSets offer a baseline, but they lack the operational logic needed for tasks such as schema upgrades, engine patching, or cluster-wide Kubernetes upgrades.
-
Data Mobility: Moving persistent data remains a significant hurdle - whether migrating between storage tiers, shifting workloads across availability zones, or moving to a different cluster. This challenge includes ongoing synchronization and replication for high availability and disaster recovery across a distributed system.
Storage and AI
How do you see storage evolving in Kubernetes over the next few years, especially as AI/ML workloads grow?
I see several trends shaping storage in Kubernetes as it evolves from a container orchestrator into the "Operating System" for AI:
-
More Intelligent Data Management: We'll see a shift toward smarter CSI drivers and data management tools offering advanced features like automatic tiering, snapshots, migration, and replication - optimized specifically for high-performance AI/ML workflows and large data platforms.
-
Object Storage as a First-Class Citizen: AI datasets now frequently reach exabyte scale, making object storage the preferred choice for AI workloads. COSI is standardizing bucket management just as CSI did for disks, allowing data scientists to use a BucketClaim to provision S3-compatible storage natively and unifying object, file, and block storage into a single workflow.
-
Performance and Low Latency: For AI/ML, storage needs to keep up with GPU processing speeds. This will accelerate adoption of high-performance parallel file systems and NVMe-over-Fabrics (NVMe-oF) technologies managed natively via Kubernetes. The line between traditional block/file and memory-speed storage will continue to blur.
-
Data-Aware Scheduling: Instead of just considering CPU and RAM, the Kubernetes scheduler will increasingly prioritize placing Pods based on data locality - calculating the cost of moving data versus moving compute to keep massive data platforms performant.
SIG Storage continues to tackle some of the hardest problems in Kubernetes: keeping stateful applications running reliably, making storage operations transparent and composable, and now scaling up to meet the demands of AI-era workloads. Whether you're a user managing databases in production or a developer curious about storage internals, there's a place for you in SIG Storage.
If you'd like to get involved, check out the SIG Storage community page and join the bi-weekly meetings. You can also find the SIG on Slack at #sig-storage.
15 Jun 2026 12:00am GMT
01 Jun 2026
Kubernetes Blog
From Kubernetes Dashboard to Headlamp: Understanding the Transition
For many people, Kubernetes Dashboard was their first window into Kubernetes. It offered a simple visual way to see what was running in a cluster, inspect resources, and build confidence without relying on the command line. For years, it helped developers, students, and operators make sense of Kubernetes, and it served as an important onramp into the ecosystem.
The Kubernetes Dashboard project has now been archived. We deeply respect the work the team did and the role Dashboard played in making Kubernetes more approachable for so many users.
Headlamp builds on that foundation and carries it forward. It keeps the clarity of a visual interface while adding capabilities that match how Kubernetes is used today. This includes multi-cluster visibility, application-centric views, extensibility through plugins, and flexible deployment options that work both in-cluster and on the desktop.
This guide is meant to help you navigate that transition with confidence. Before diving into the mechanics of migration, we start with familiar ground by looking at how common Kubernetes Dashboard workflows map to Headlamp. We also cover what stays the same and what improves after the switch. The goal is not just to replace a tool, but to honor a user-centered legacy and help you land in a UI that can grow with you as your Kubernetes usage evolves.
Mapping Kubernetes Dashboard workloads to Headlamp
If you have used Kubernetes Dashboard before, many workflows in Headlamp will feel familiar. Headlamp does not introduce a new way of thinking. Instead, it builds on workloads users already know and extends them in practical ways. The focus is continuity. What worked before still works, with more room to grow.
Viewing workloads and resources
In Kubernetes Dashboard, most users started by browsing workloads like pods, deployments, services, and namespaces. Headlamp keeps this same starting point. Workloads are easy to find and inspect, and moving between namespaces and clusters is simpler. Resources are still organized in familiar ways, and navigation feels smoother, especially when you work across multiple environments.
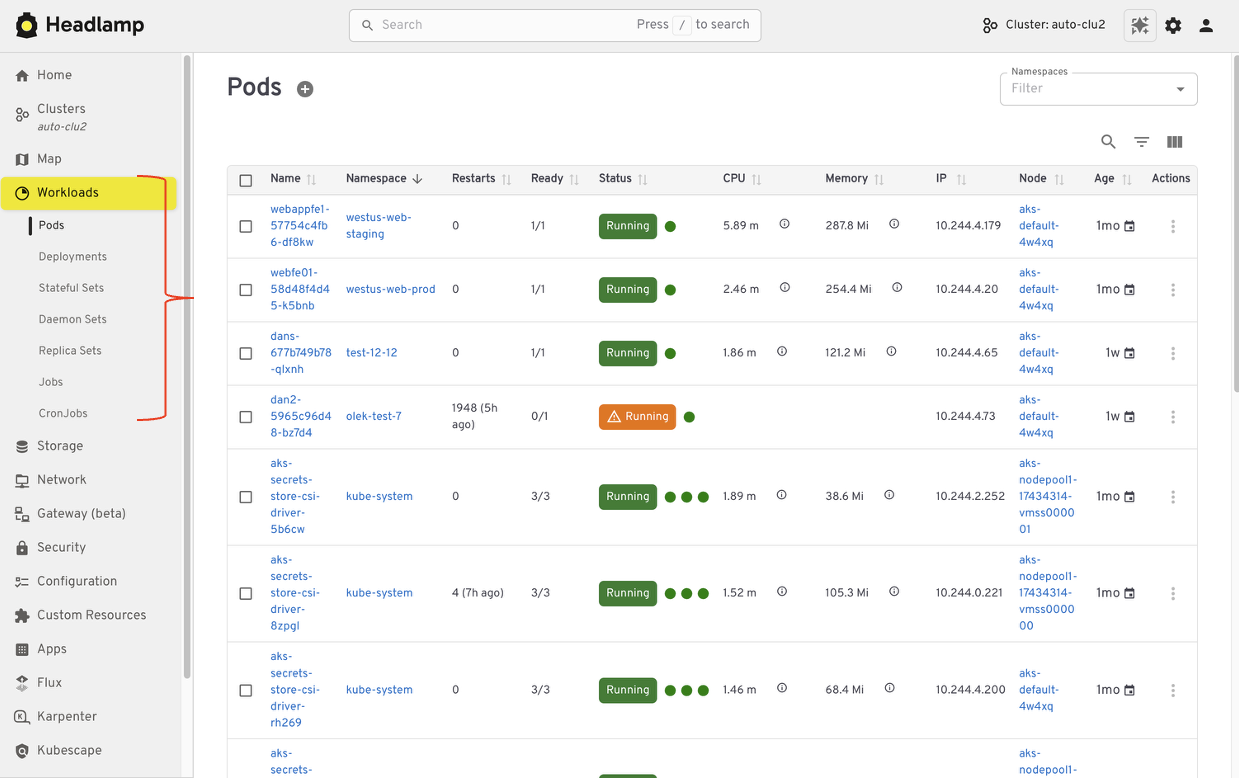
Editing and interacting with resources
Like Kubernetes Dashboard, Headlamp lets you view and edit manifests directly in the UI based on your permissions. You can delete resources, scale workloads, or update configurations from the interface. All actions follow standard Kubernetes RBAC. If you could perform an action in Dashboard, you will find the same capability in Headlamp, with the same respect for access controls.
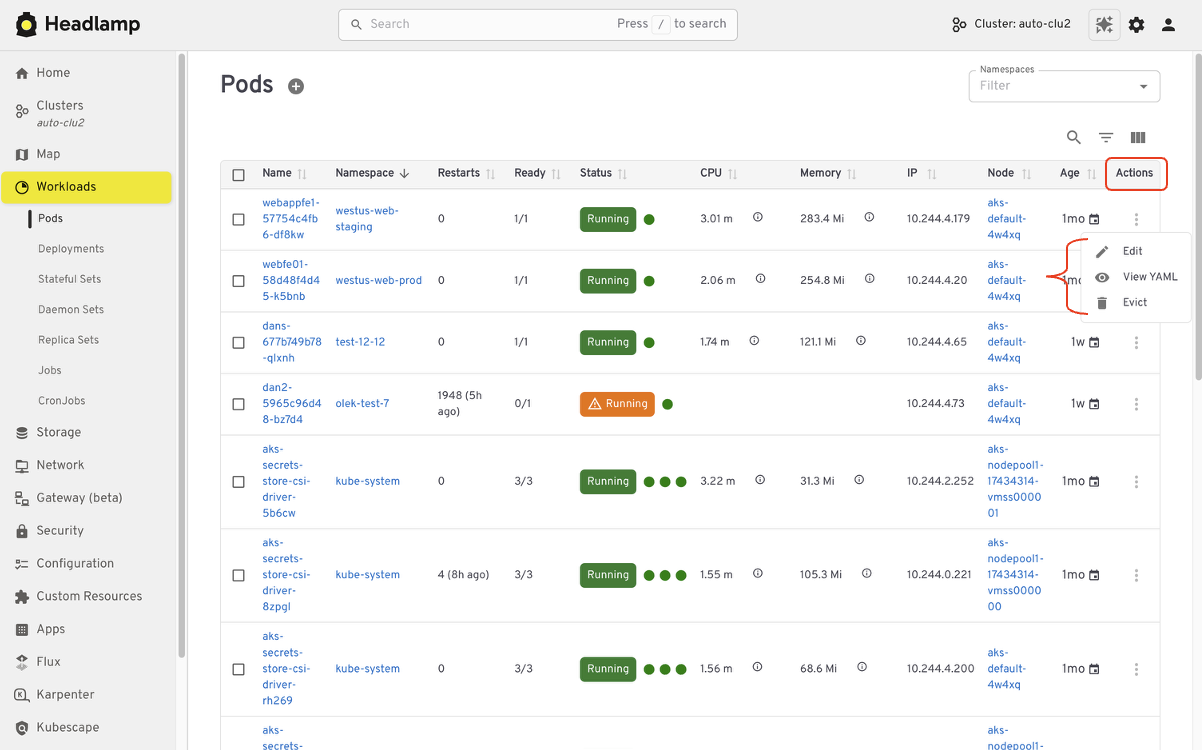
Understanding relationships
Where Headlamp begins to expand the experience is in how it presents relationships between resources. In addition to list views, Headlamp offers visual ways to see how workloads, services, and configurations connect. This helps provide context without changing the underlying workloads users already rely on.
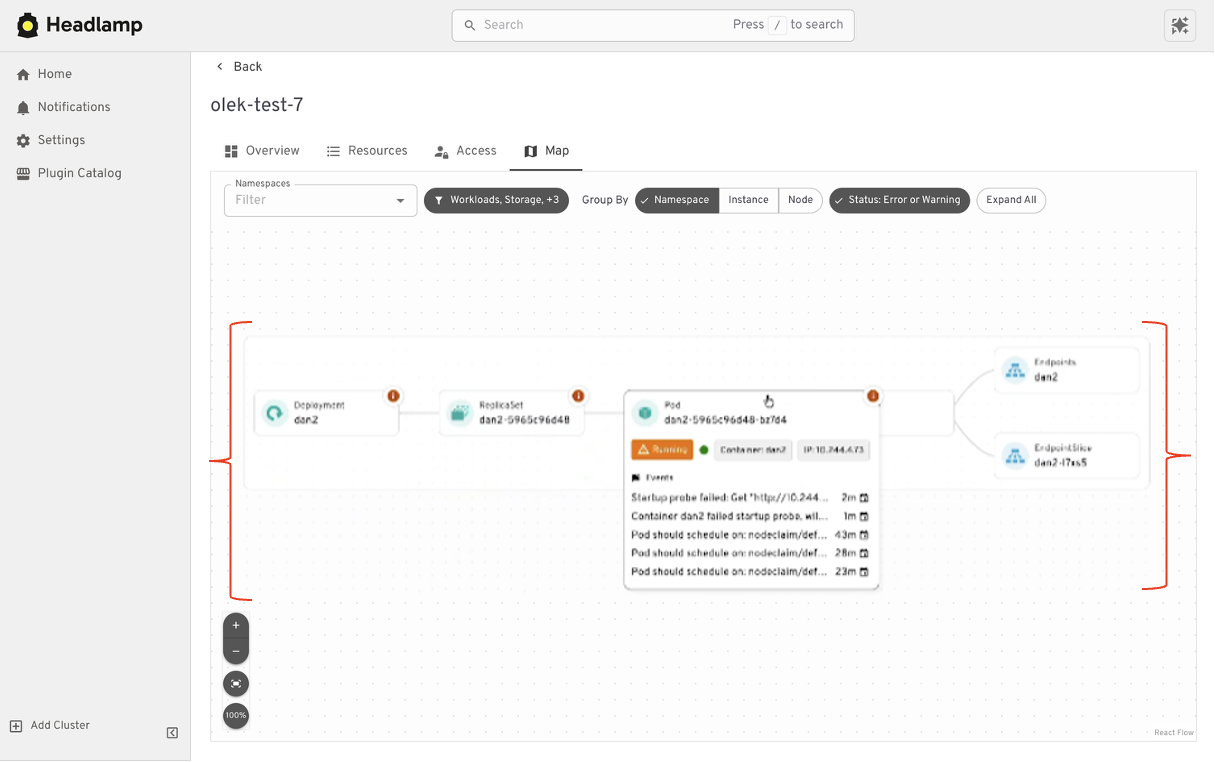
At a high level, the tasks you performed in Kubernetes Dashboard are still there. Headlamp keeps familiar workflows while making it easier to scale as clusters, teams, and applications grow.
Where Headlamp goes beyond Kubernetes Dashboard
Expanding from single cluster to multi-cluster workflows
Kubernetes Dashboard was designed to work with one cluster at a time. That model worked well for simple setups, but it became limiting as teams adopted multiple environments. Headlamp expands this view by letting you work with multiple clusters from a single interface without switching tools or losing context. This makes it easier to manage development, staging, and production environments side by side.
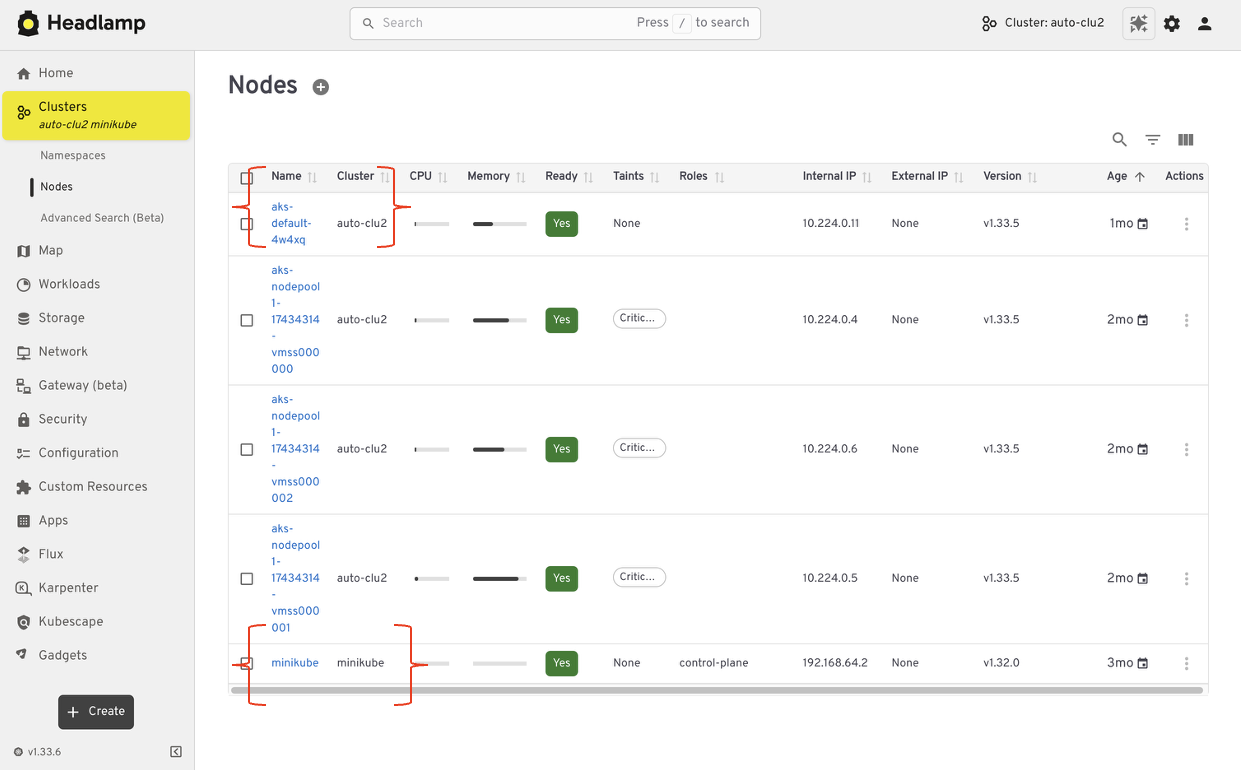
For teams running Kubernetes in more than one place, this shift reduces friction. You can stay oriented and move between clusters with confidence.
From resource lists to application context with Projects
Projects give you an application-centered way to view Kubernetes. Instead of jumping between lists, you can group related workloads, services, and supporting resources in one place. This makes applications easier to understand. You can see what belongs together, track changes in context, and troubleshoot without scanning the cluster piece by piece.
Projects are built on native Kubernetes concepts. Namespaces, labels, and RBAC continue to work the same way they always have. Headlamp adds a visual layer that brings related resources together.
Projects are optional. You can still work at the individual resource level when that fits your task. When you need more context, Projects help you step back and see the bigger picture.
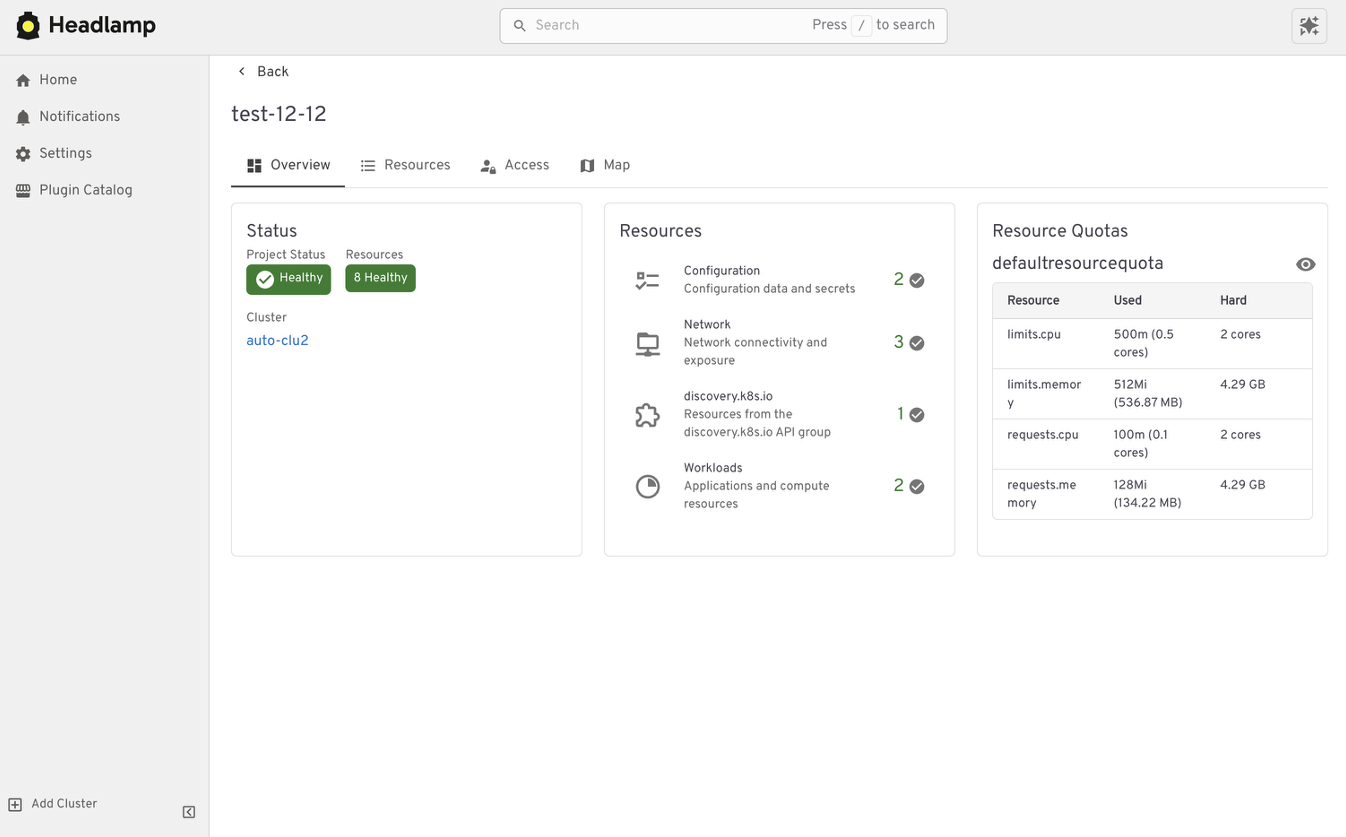
Extend the Headlamp UI with plugins
Headlamp can be extended through plugins that bring common workflows directly into the UI. Instead of switching tools, you work in one place with the same context.
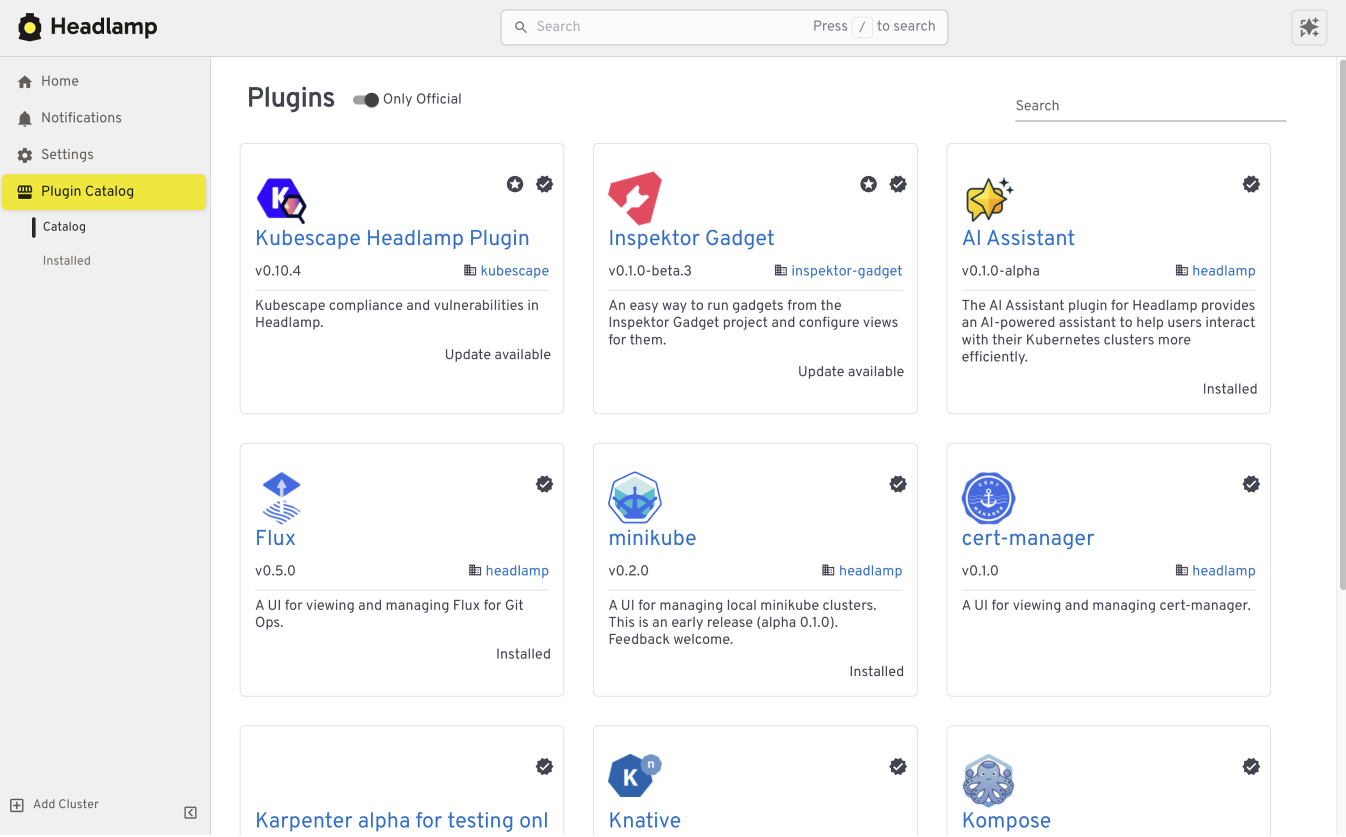
For example, the Flux plugin brings GitOps workflows into Headlamp. It allows teams to view application state alongside the Kubernetes resources that Flux manages, making it easier to understand how changes in Git relate to what is running in the cluster.
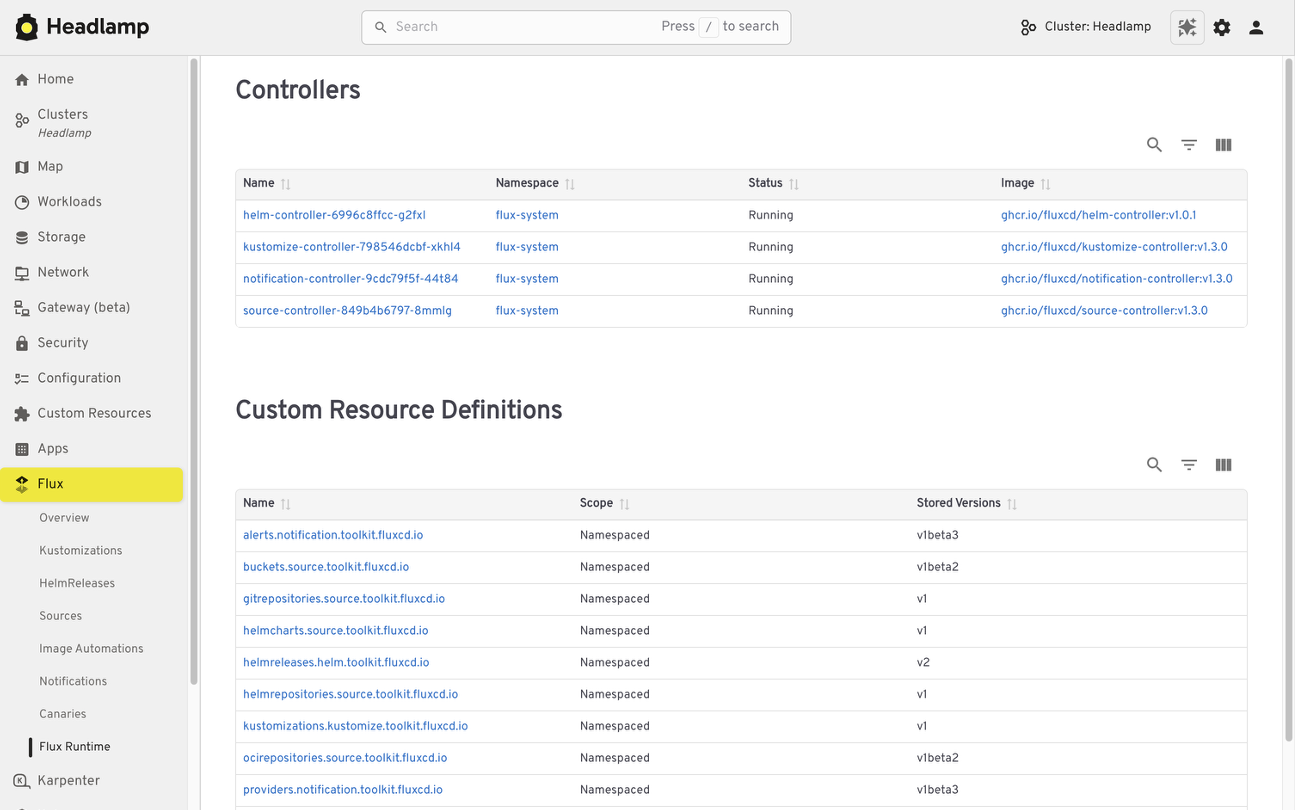
The AI Assistant follows a similar pattern. It adds a conversational layer to the UI that helps users understand what they are seeing, troubleshoot issues, or take action. All of this happens in the same screen where the problem appears.
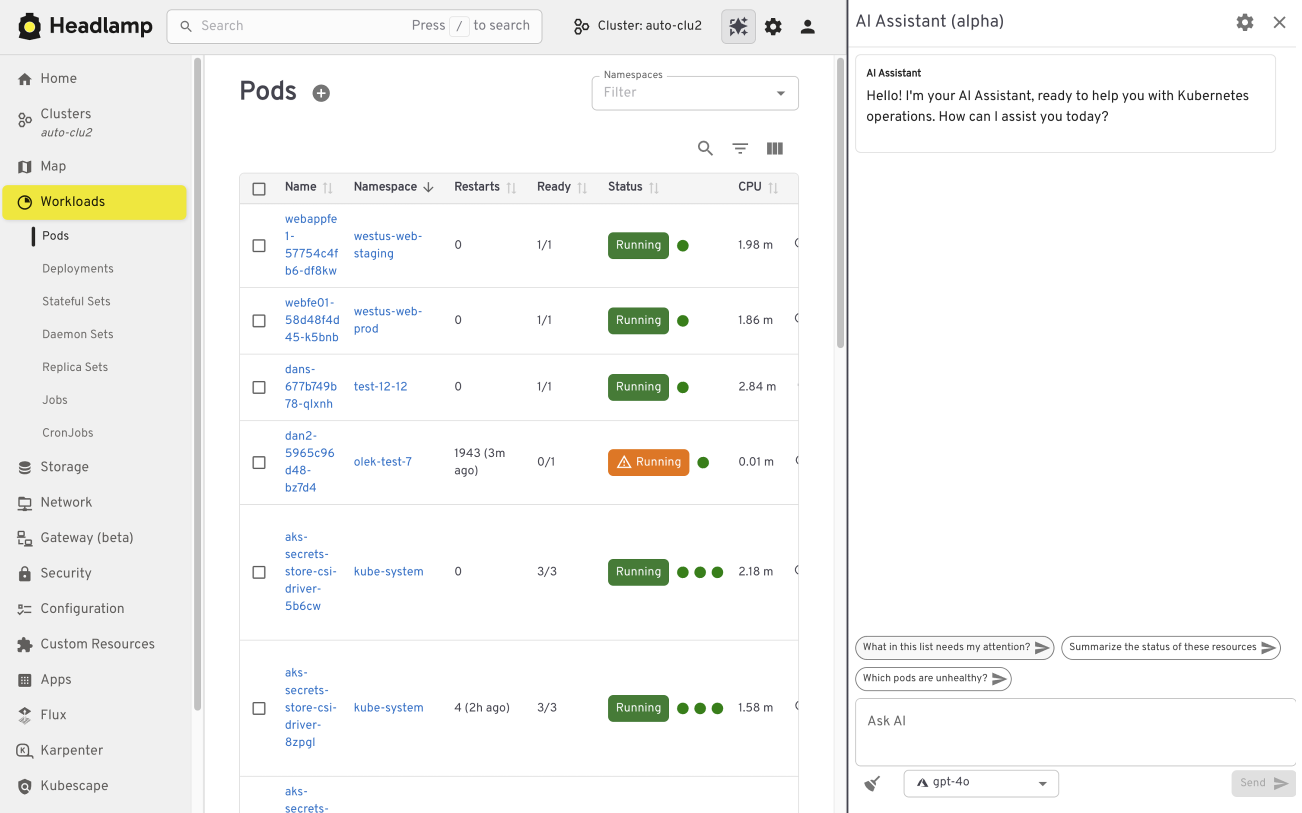
Building your own plugins
Plugins are optional and not limited to community-built extensions. Platform and project teams can also create their own plugins. This allows organizations to add custom integrations that match their specific workflows and internal tooling, while keeping the user experience consistent.
Choosing how and where Headlamp runs
Headlamp gives teams flexibility in how they use a Kubernetes UI. You can run it directly in a cluster, use it as a desktop application, or combine both approaches based on your needs.
Running Headlamp in-cluster works well for shared environments. It provides a centrally managed UI with controlled access and fits naturally into Kubernetes setups, following the same authentication and RBAC rules as other in-cluster components.
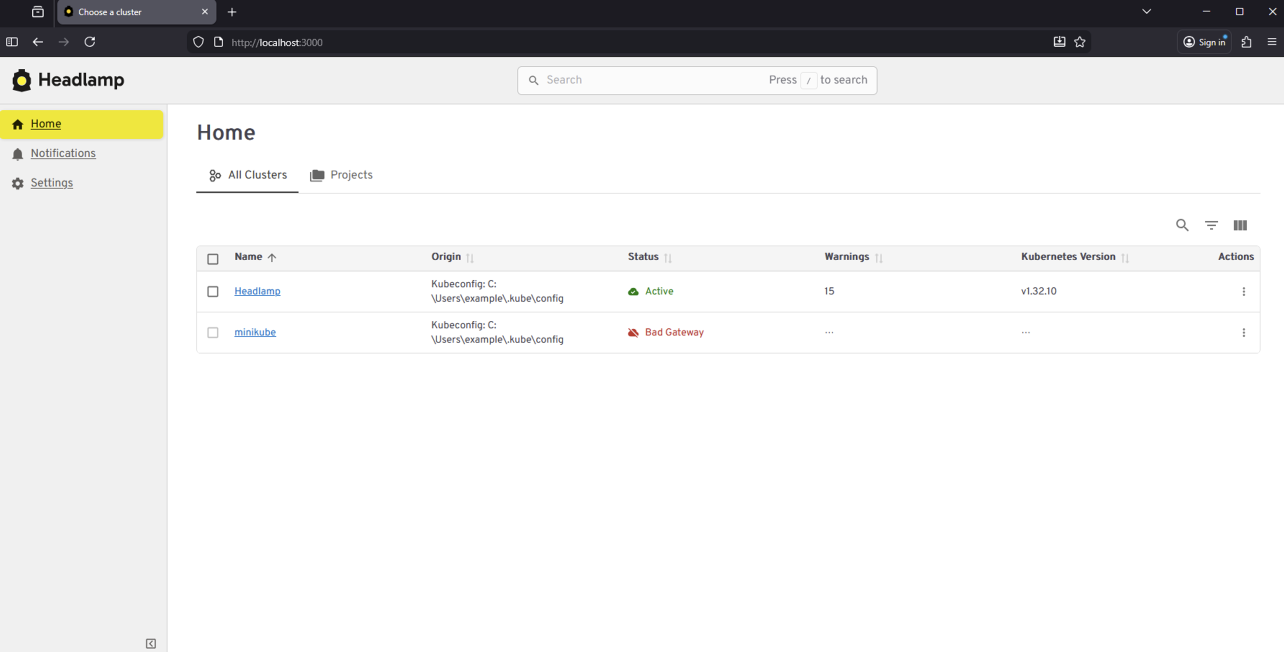
The desktop application is often a better fit for local development and onboarding. It also works well when you need to manage multiple clusters from one place. Users can connect using their existing kubeconfig without deploying anything into the cluster.
These options are not mutually exclusive. Many teams use the desktop app for day-to-day work, while relying on an in-cluster deployment for shared or production environments.
Preparing for the Migration
Before moving from Kubernetes Dashboard to Headlamp, it can be helpful to pause and take stock of how you use the Dashboard today. A little reflection up front can go a long way toward making the transition feel smooth and familiar.
Start by noting which clusters and namespaces you access and how authentication works. Headlamp relies on standard Kubernetes authentication and RBAC. In most cases, existing access models carry over without change. If users already connect using kubeconfig files or service accounts, they will be able to access the same resources in Headlamp.
It is also useful to think about the workflows that matter most to your team. Some users rely on Dashboard for quick inspection or troubleshooting, while others use it for lightweight edits or validation. Headlamp supports these same workflows and adds optional capabilities on top. Knowing what you rely on today helps the transition feel predictable and confidence building.
If you would like to explore Headlamp or try it out before migrating, you can learn more at headlamp.dev.
This blog focused on understanding the transition and what to expect. A step by step migration guide is coming soon and will walk through installation and migration in detail.
01 Jun 2026 6:00pm GMT
26 May 2026
Kubernetes Blog
Reconciling the Past: Correcting Records for Unfixed Kubernetes CVEs
The Kubernetes project relies on transparency to empower cluster administrators and security researchers. One important way we do that is by publishing CVE records into the Common Vulnerabilities and Exposures database. As part of our ongoing effort to mature the official Kubernetes CVE Feed, we have identified some discrepancies. CVE records for a few older, unfixed issues incorrectly include a fixed version field.
The Kubernetes Security Response Committee (SRC) will correct the affected CVE records on June 1, 2026. This may result in vulnerability scanners identifying these vulnerabilities in places where they were previously not detected.
To help reduce confusion, this post provides a technical update on three vulnerabilities that were disclosed in previous years but remain unfixed: CVE-2020-8561, CVE-2020-8562, and CVE-2021-25740.
Why we are updating these records now
While these vulnerabilities have been public for several years, the recent work to generate official Open Source Vulnerabilities (OSV) files revealed that their corresponding CVE records did not accurately reflect their status. Specifically, some records suggested a fixed version existed, when in reality, these issues are architectural design trade-offs that cannot be fully remediated through code without breaking fundamental Kubernetes functionality.
Correcting these records is vital for the community for:
- Automation Fidelity: Modern vulnerability scanners depend on precise version ranges. Inaccurate fixed tags lead to false negatives, giving users a false sense of security.
- Risk Documentation: By formalizing these as unfixed, we ensure that platform providers and administrators are aware of the persistent need for administrative mitigations.
For completeness, we should also mention that CVE-2020-8554 is an unfixed CVE with a correct CVE record stating that it affects all versions. That record will also be updated to use a more-standardized version number format.
Technical analysis of unfixed architectural risks
The following vulnerabilities will not be fixed by the Kubernetes project. GitHub issues remain the best reference for the technical mechanics of these flaws.
CVE-2020-8561: Webhook redirect in kube-apiserver
- Severity: Medium (4.1).
- The Issue: The kube-apiserver follows HTTP redirects when communicating with admission webhooks. An actor capable of configuring an AdmissionWebhookConfiguration can redirect API server requests to internal, private networks.
- Why it remains unfixed: Restricting this behavior would require breaking the standard HTTP client behavior that many legitimate integrations rely on.
- Mitigation: Set the API server log level to less than 10 (to prevent logging response bodies) and disable dynamic profiling (
--profiling=false) to prevent unauthorized log-level changes.
CVE-2020-8562: Proxy bypass via DNS TOCTOU
- Severity: Low (3.1).
- The Issue: A Time-of-Check to Time-of-Use (TOCTOU) race condition in the API server proxy allows users to bypass IP restrictions. The system performs a DNS check to validate an IP, but then performs a second resolution for the actual connection, which an attacker can manipulate.
- Why it remains unfixed: Fixing this requires pinning resolved IPs in a way that breaks complex split-horizon DNS or dynamic IP environments.
- Mitigation: Use a local DNS caching server like dnsmasq for the API server and configure
min-cache-ttlto enforce consistent responses between the check and the connection.
CVE-2021-25740: Cross-namespace forwarding via Endpoints
- Severity: Low (3.1).
- The Issue: A design flaw in the Endpoints and EndpointSlice API objects allows users to manually specify IP addresses, which can be used to point a LoadBalancer or Ingress toward backends in other namespaces.
- Why it remains unfixed: This is a fundamental feature of the Endpoints API used by many networking tools and operators.
- Mitigation: Restrict write access to Endpoints (legacy) and EndpointSlices. Since Kubernetes 1.22, Kubernetes RBAC authorization mode no longer includes those permissions in the default edit and admin ClusterRoles. That removal applies to clusters created using Kubernetes v1.22; for clusters upgraded from older versions, administrators should manually audit and reconcile the
system:aggregate-to-editClusterRole.
Note:
On June 1, 2026, these CVE records will be updated to correctly reflect the fact that all versions are affected. You may see them begin to appear in vulnerability scanner results.Required actions for administrators
The Kubernetes project recommends a secure by configuration approach to manage these persistent risks:
| Vulnerability | Action item | Severity score (Rating) | Command / configuration |
|---|---|---|---|
| CVE-2020-8561 | Restrict Log Verbosity | 4.1 (Medium) | Ensure --v is set to < 10 and --profiling=false. |
| CVE-2020-8562 | Enforce DNS Consistency | 3.1 (Low) | Deploy dnsmasq or a similar caching resolver on control plane nodes. |
| CVE-2021-25740 | Hardened RBAC | 3.1 (Low) | kubectl auth reconcile to remove Endpoints write access from broad roles. |
The RBAC action for CVE-2021-25740 applies when your cluster uses RBAC authorization mode, which is the default for clusters created with standard Kubernetes tooling. Administrators should independently test and validate these configurations in a non-production environment, assessing the architectural risks against their specific threat model and risk tolerance.
Conclusion: maturity through transparency
The effort to reconcile these records is a sign of a maturing security ecosystem. By moving away from the "patch-only" mindset and accurately documenting architectural debt, the Kubernetes project provides the community with the high-fidelity data needed to secure modern cloud native infrastructure.
We would like to thank the security researchers-QiQi Xu, Javier Provecho, and others-who identified these risks, and the SIG Security Tooling contributors who continue to refine our official feeds. Special shoutout to Rory McCune for sharing information around these CVEs through his blog posts.
Update 2026/06/01: Today, the Kubernetes SRC has updated the CVE records for CVE-2020-8554, CVE-2020-8561, CVE-2020-8562, and CVE-2021-25740.
26 May 2026 5:30pm GMT
20 May 2026
Kubernetes Blog
Announcing etcd 3.7.0-beta.0
SIG-Etcd announces the availability of the first beta release of etcd v3.7.0. This new version of the popular distributed database and key Kubernetes component includes the long-requested RangeStream feature, as well as a refactoring and cleanup of multiple legacy components and interfaces. v3.7 will deliver improved security, better operational reliability, and an improved experience for working with large resultsets.
First, however, the project needs users to test the beta. You can find v3.7.0-beta.0 here:
Please try it out and report issues in the etcd repo.
This beta also determines the EOL of version 3.4.
RangeStream
In etcd v3.6 and earlier, it is challenging to work with requests that return large resultsets. The client or requesting application is forced to wait for the full result set, leading to unpredictable latency and memory usage. The RangeStream RPC lets calling applications accept result sets in chunks, reducing latency and making buffering memory usage more predictable.
Much of the work on RangeStream was done by a relatively new contributor to etcd, Jeffrey Ying, a software engineer at Google. New contributors can have a substantial impact on etcd development.
"I've always been fascinated by database internals, and building RangeStream was a great opportunity to solve a bottleneck we were hitting in production with Kubernetes. It was the perfect opportunity to collaborate across projects and improve the ecosystem as a whole. Jumping into etcd as a new contributor had a bit of a learning curve, but the community is incredibly welcoming. The leads were very receptive to my ideas and helped me iterate quickly, while maintaining the project's high bar for reliability and code quality," said Jeffrey.
Instructions on how to use RangeStream in gRPC calls and in etcdctl can be found in the etcd documentation. Users should try it out for their own applications.
Removal of v2store
The last vestiges of etcd v2store have been removed in v3.7, making this the first release that is 100% on v3store. This includes discovery, bootstrap, v2 requests, and the v2 client. Our team has also removed multiple deprecated experimental flags.
All of these changes may create some breakage for users, particularly those who have not already updated to v3.6.11. We are interested in hearing about blockers encountered by users and dependent applications; please report anything you find that can't be remedied or needs better upgrade documentation.
etcd v3.7.0-beta.0 also includes bbolt v1.5.0 and raft v3.7.0.
3.4 EOL
According to our community support policy, we typically maintain only the latest two minor versions, currently v3.6 and v3.5. Etcd v3.5 will be supported for 1 year after v3.7.0 final release.
As mentioned in extended support for v3.4 in the etcd v3.6.0 release announcement, etcd v3.4 has been EOL since May 15, 2026. SIG-etcd may release one more security patch for that version at the end of May, if warranted by patched vulnerabilities. In any case, it will cease being updated after the end of May. Users on v3.4 should be planning to upgrade their clusters.
Feedback and Future Betas
Reach the etcd contributors with your feedback about v3.7.0-beta.0 in any of the following places:
SIG-etcd may release additional betas of version v3.7.0 with additional refactoring, particularly of our use of protobuf libraries. Release candidates and the final release will probably happen through June, possibly into early July.
20 May 2026 12:00am GMT
15 May 2026
Kubernetes Blog
Kubernetes v1.36: New Metric for Route Sync in the Cloud Controller Manager
This article was originally published with the wrong date. It was later republished, dated the 15th of May 2026.
Kubernetes v1.36 introduces a new alpha counter metric route_controller_route_sync_total to the Cloud Controller Manager (CCM) route controller implementation at k8s.io/cloud-provider. This metric increments each time routes are synced with the cloud provider.
A/B testing watch-based route reconciliation
This metric was added to help operators validate the CloudControllerManagerWatchBasedRoutesReconciliation feature gate introduced in Kubernetes v1.35. That feature gate switches the route controller from a fixed-interval loop to a watch-based approach that only reconciles when nodes actually change. This reduces unnecessary API calls to the infrastructure provider, lowering pressure on rate-limited APIs and allowing operators to make more efficient use of their available quota.
To A/B test this, compare route_controller_route_sync_total with the feature gate disabled (default) versus enabled. In clusters where node changes are infrequent, you should see a significant drop in the sync rate with the feature gate turned on.
Example: expected behavior
With the feature gate disabled (the default fixed-interval loop), the counter increments steadily regardless of whether any node changes occurred:
# After 10 minutes with no node changes
route_controller_route_sync_total 60
# After 20 minutes, still no node changes
route_controller_route_sync_total 120
With the feature gate enabled (watch-based reconciliation), the counter only increments when nodes are actually added, removed, or updated:
# After 10 minutes with no node changes
route_controller_route_sync_total 1
# After 20 minutes, still no node changes - counter unchanged
route_controller_route_sync_total 1
# A new node joins the cluster - counter increments
route_controller_route_sync_total 2
The difference is especially visible in stable clusters where nodes rarely change.
Where can I give feedback?
If you have feedback, feel free to reach out through any of the following channels:
- The #sig-cloud-provider channel on Kubernetes Slack
- The KEP-5237 issue on GitHub
- The SIG Cloud Provider community page for other communication channels
How can I learn more?
For more details, refer to KEP-5237.
15 May 2026 6:35pm GMT
Kubernetes v1.36: Mixed Version Proxy Graduates to Beta
Back in Kubernetes 1.28, we introduced the Mixed Version Proxy (MVP) as an Alpha feature (under the feature gate UnknownVersionInteroperabilityProxy) in a previous blog post. The goal was simple but critical: make cluster upgrades safer by ensuring that requests for resources not yet known to an older API server are correctly routed to a newer peer API server, instead of returning an incorrect 404 Not Found.
We are excited to announce that the Mixed Version Proxy is moving to Beta in Kubernetes 1.36 and will be enabled by default! The feature has evolved significantly since its initial release, addressing key gaps and modernizing its architecture.
Here is a look at how the feature has evolved and what you need to know to leverage it in your clusters.
What problem are we solving?
In a highly available control plane undergoing an upgrade, you often have API servers running different versions. These servers might serve different sets of APIs (Groups, Versions, Resources). Without MVP, if a client request lands on an API server that does not serve the requested resource (e.g., a new API version introduced in the upgrade), that server returns a 404 Not Found. This is technically incorrect because the resource is available in the cluster, just not on that specific server. This can lead to serious side effects, such as mistaken garbage collection or blocked namespace deletions. MVP solves this by proxying the request to a peer API server that can serve it.
sequenceDiagram
participant Client
participant API_Server_A as API Server A (Older/Different)
participant API_Server_B as API Server B (Newer/Capable)
Client->>API_Server_A: 1. Request for Resource (e.g., v2)
Note over API_Server_A: Determines it cannot serve locally
API_Server_A->>API_Server_A: 2. Looks up capable peer in Discovery Cache
API_Server_A->>API_Server_B: 3. Proxies request (adds x-kubernetes-peer-proxied header)
API_Server_B->>API_Server_B: 4. Processes request locally
API_Server_B-->>API_Server_A: 5. Returns Response
API_Server_A-->>Client: 6. Forwards Response
How has it evolved since 1.28
The initial Alpha implementation was a great proof of concept, but it had some limitations and relied on older mechanisms. Here is how we have modernized it for Beta:
-
From StorageVersion API to Aggregated Discovery In the Alpha version, API servers relied on the
StorageVersion APIto figure out which peers served which resources. While functional, this approach had a significant limitation: theStorageVersion APIis not yet supported for CRDs and aggregated APIs. For Beta, we have replaced the reliance onStorageVersion APIcalls with the use ofAggregated Discovery. API servers now use the aggregated discovery data to dynamically understand the capabilities of their peers. -
The Missing Piece: Peer-Aggregated Discovery The 1.28 blog post noted a significant gap: while we could proxy resource requests, discovery requests still only showed what the local API server knew about. In 1.36, we have added
Peer-Aggregated Discoverysupport! Now, when a client performs discovery (e.g., listing available APIs), the API server merges its local view with the discovery data from all active peers. This provides clients with a complete, unified view of all APIs available across the entire cluster, regardless of which API server they connected to.
sequenceDiagram
participant Client
participant API_Server_A as API Server A
participant API_Server_B as API Server B
Client->>API_Server_A: 1. Request Discovery Document
API_Server_A->>API_Server_A: 2. Gets Local APIs
API_Server_A->>API_Server_B: 3. Gets Peer APIs (Cached or Direct)
API_Server_A->>API_Server_A: 4. Merges and sorts lists deterministically
API_Server_A-->>Client: 5. Returns Unified Discovery Document
While peer-aggregated discovery will be the default behavior (note that peer-aggregated discovery is enabled if the --peer-ca-file flag is set, otherwise the server will fallback to showing only its local APIs), there may be cases where you need to inspect only the resources served by the specific API server you are connected to. You can request this non-aggregated view by including the profile=nopeer parameter in your request's Accept header (e.g., Accept: application/json;g=apidiscovery.k8s.io;v=v2;as=APIGroupDiscoveryList;profile=nopeer).
Required configuration
While the feature gate will be enabled by default, it requires certain flags to be set to allow for secure communication between peer API servers. To function correctly, make sure your API server is configured with the following flags:
--feature-gates=UnknownVersionInteroperabilityProxy=true: This will be default in 1.36, but it is good to verify--peer-ca-file=<path-to-ca>: [CRITICAL] This is a required flag. You must provide the CA bundle that the source API server will use to authenticate the serving certificates of destination peer API servers. Without this, proxying will fail due to TLS verification errors.--peer-advertise-ipand--peer-advertise-port: These flags are used to set the network address that peers should use to reach this API server. If unset, the values from--advertise-addressor--bind-addressare used. If you have complex network topologies where API servers communicate over a specific internal interface, setting these flags explicitly is highly recommended.
Configuring with kubeadm
If you manage your cluster with kubeadm, you can configure these flags in your ClusterConfiguration file:
apiVersion: kubeadm.k8s.io/v1beta4
kind: ClusterConfiguration
apiServer:
 extraArgs:
 peer-ca-file: "/etc/kubernetes/pki/ca.crt"
 # peer-advertise-ip and port if needed
Call to action
If you are running multi-master clusters and upgrading them regularly, the Mixed Version Proxy is a major safety improvement. With it becoming default in 1.36, we encourage you to:
- Review your API server flags to ensure
--peer-ca-fileis set properly. - Test the feature in your staging environments as you prepare for the 1.36 upgrade.
- Provide feedback to SIG API Machinery (Slack, mailing list, or by attending SIG API Machinery meetings) on your experience.
15 May 2026 6:00pm GMT
14 May 2026
Kubernetes Blog
Kubernetes v1.36: Deprecation and removal of Service ExternalIPs
The .spec.externalIPs field for Service was an early attempt to provide cloud-load-balancer-like functionality for non-cloud clusters. Unfortunately, the API assumes that every user in the cluster is fully trusted, and in any situation where that is not the case, it enables various security exploits, as described in CVE-2020-8554.
Since Kubernetes 1.21, the Kubernetes project has recommended that all users disable .spec.externalIPs. To make that easier, Kubernetes also added an admission controller (DenyServiceExternalIPs) that can be enabled to do this. At the time, SIG Network felt that blocking the functionality by default was too large a breaking change to consider.
However, the security problems are still there, and as a project we're increasingly unhappy with the "insecure by default" state of the feature. Additionally, there are now several better alternatives for non-cloud clusters wanting load-balancer-like functionality.
As a result, the .spec.externalIPs field for Service is now formally deprecated in Kubernetes 1.36. We expect that a future minor release of Kubernetes will drop implementation of the behavior from kube-proxy, and will update the Kubernetes conformance criteria to require that conforming implementations do not provide support.
A note on terminology, and what hasn't been deprecated
The phrase external IP is somewhat overloaded in Kubernetes:
-
The Service API has a field
.spec.externalIPsthat can be used to add additional IP addresses that a Service will respond on. -
The Node API's
.status.addressesfield can list addresses of several different types, one of which is calledExternalIP. -
The
kubectltool, when displaying information about a Service of type LoadBalancer in the default output format, will show the load balancer IP address under the column headingEXTERNAL-IP.
This deprecation is about the first of those. If you are not setting the field externalIPs in any of your Services, then it does not apply to you.
That said, as a precaution, you may still want to enable the DenyServiceExternalIPs admission controller to block any future use of the externalIPs field.
Alternatives to externalIPs
If you are using .spec.externalIPs, then there are several alternatives.
Consider a Service like the following:
apiVersion: v1
kind: Service
metadata:
 name: my-example-service
spec:
 type: ClusterIP
 selector:
 app.kubernetes.io/name: my-example-app
 ports:
 - protocol: TCP
 port: 80
 targetPort: 8080
 externalIPs:
 - "192.0.2.4"
Using manually-managed LoadBalancer Services instead of externalIPs
The easiest (but also worst) option is to just switch from using externalIPs to using a type: LoadBalancer service, and assigning a load balancer IP by hand. This is, essentially, exactly the same as externalIPs, with one important difference: the load balancer IP is part of the Service's .status, not its .spec, and in a cluster with RBAC enabled, it can't be edited by ordinary users by default. Thus, this replacement for externalIPs would only be available to users who were given permission by the admins (although those users would then be fully empowered to replicate CVE-2020-8554; there would still not be any further checks to ensure that one user wasn't stealing another user's IPs, etc.)
Because of the way that .status works in Kubernetes, you must create the Service without a load balancer IP, and then add the IP as a second step:
$ cat loadbalancer-service.yaml
apiVersion: v1
kind: Service
metadata:
 name: my-example-service
spec:
 # prevent any real load balancer controllers from managing this service
 # by using a non-existent loadBalancerClass
 loadBalancerClass: non-existent-class
 type: LoadBalancer
 selector:
 app.kubernetes.io/name: my-example-app
 ports:
 - protocol: TCP
 port: 80
 targetPort: 8080
$ kubectl apply -f loadbalancer-service.yaml
service/my-example-service created
$ kubectl patch service my-example-service --subresource=status --type=merge -p '{"status":{"loadBalancer":{"ingress":[{"ip":"192.0.2.4"}]}}}'
Using a non-cloud based load balancer controller
Although LoadBalancer services were originally designed to be backed by cloud load balancers, Kubernetes can also support them on non-cloud platforms by using a third-party load balancer controller such as MetalLB. This solves the security problems associated with externalIPs because the administrator can configure what ranges of IP addresses the controller will assign to services, and the controller will ensure that two services can't both use the same IP.
So, for example, after installing and configuring MetalLB, a cluster administrator could configure a pool of IP addresses for use in the cluster:
apiVersion: metallb.io/v1beta1
kind: IPAddressPool
metadata:
 name: production
 namespace: metallb-system
spec:
 addresses:
 - 192.0.2.0/24
 autoAssign: true
 avoidBuggyIPs: false
After which a user can create a type: LoadBalancer Service and MetalLB will handle the assignment of the IP address. MetalLB even supports the deprecated loadBalancerIP field in Service, so the end user can request a specific IP (assuming it is available) for backward-compatibility with the externalIPs approach, rather than being assigned one at random:
apiVersion: v1
kind: Service
metadata:
 name: my-example-service
spec:
 type: LoadBalancer
 selector:
 app.kubernetes.io/name: my-example-app
 ports:
 - protocol: TCP
 port: 80
 targetPort: 8080
 loadBalancerIP: "192.0.2.4"
Similar approaches would work with other load balancer controllers. This approach can allow cluster administrators to have control over which IP addresses are assigned, rather than users.
Using Gateway API
Another potential solution is to use an implementation of the Gateway API.
Gateway API allows cluster administrators to define a Gateway resource, which can have an IP address attached to it via the .spec.addresses field. Since Gateway resources are designed to be managed by cluster administrators, RBAC rules can be put in place to only allow privileged users to manage them.
An example of how this could look is:
apiVersion: gateway.networking.k8s.io/v1
kind: Gateway
metadata:
 name: example-gateway
spec:
 gatewayClassName: example-gateway-class
 addresses:
 - type: IPAddress
 value: "192.0.2.4"
---
apiVersion: gateway.networking.k8s.io/v1
kind: HTTPRoute
metadata:
 name: example-route
spec:
 parentRefs:
 - name: example-gateway
 rules:
 - backendRefs:
 - name: example-svc
 port: 80
---
apiVersion: v1
kind: Service
metadata:
 name: example-svc
spec:
 type: ClusterIP
 selector:
 app.kubernetes.io/name: example-app
 ports:
 - protocol: TCP
 port: 80
 targetPort: 8080
The Gateway API project is the next generation of Kubernetes Ingress, Load Balancing, and Service Mesh APIs within Kubernetes. Gateway API was designed to fix the shortcomings of the Service and Ingress resource, making it a very reliable robust solution that is under active development.
Timeline for externalIPs deprecation
The rough timeline for this deprecation is as follows:
- With the release of Kubernetes 1.36, the field was deprecated; Kubernetes now emits warnings when a user uses this field
- About a year later (v1.40 at the earliest) support for
.spec.externalIPswill be disabled in kube-proxy, but users will have a way to opt back in should they require more time to migrate away - About another year later - (v1.43 at the earliest) support will be disabled completely; users won't have a way to opt back in
14 May 2026 6:35pm GMT